Australia’s population at the end of 2010 was about 22.7 million, or about one seventh that of the United States. This puts the working population at roughly 11 million, or about half of the total population. Australia’s manufacturing is not strong, not because of outsourcing, but because of the smaller working population and limited land use because of laws protecting Aboriginal territories.
Australia is an economically developed country and has been thriving for a few decades. There are American manufacturers in Australia, but for use on the continent, not for exporting to the U.S. This is where the argument by ex-patriot corporations that says "we are making our products closer to our customers" is actually legitimate as Australians have the individual financial ability to purchase many of the products they make.
Our Free Trade Agreement with Australia started on January 1, 2005. Without exception we have had a trade surplus with Australia every year since 1985. Our trade with Australia is not as detrimental as it is with other countries for four primary reasons; resources, transportation, labor and environmental regulations none of which are any more important than the others. The cost of labor in Australia is very close to that of the U.S. because the labor laws are very similar as well, as are the environmental regulations.
Although our trade surplus with Australia may be good for us, it may not be good for them. Most of what we import from Australia is not branded as American products; although some of these imports are trans-shipped from the South West Pacific and South East Asian countries. We don’t export a lot of raw materials to make finished American products, we export things that supplements Australia’s economy, not builds it.
We trade with Australia because of mutual wants and needs. American corporations in all sectors want to do business in and with Australia, and Australians want to do business with the United States. This is an economic arraignment that benefits both countries, not one over the other. What we import from Australia is vastly different than what we import from most of our other FTA partners.
What we never or hardly ever hear about are labor disputes. There are labor unions in
Australia. It is an argument that also seems to be strongly expressed in the U.S.; that labor unions have destroyed the U.S. economy and these should be limited to the point of being outlawed. Again, if labor was the issue as claimed, American manufacturing would not be present in Australia as well as many European countries. This again goes to show that the assertion that the cost of labor makes it forbidding for manufacturing in the United States baseless.
We did import some semi-finished products in 2011. Some of this will become finished products to be exported to other countries; some of these will also become finished products and exported back to Australia. Most of what we imported was meat, poultry and other food animals. There are American corporations in Australia from different manufacturing sectors such as automotive and food processing; most of these are used within the country and some are exported. Much of what we exported to Australia was for use by U.S. manufacturers within the country.
The number one product group we imported from Australia was meet products, almost twice the number two product of non-steel metal products. Some of what was imported in 2011 from Australia were trans-shipment inventories from our future Trans-Pacific Partnership countries. These are the top 20 imports from Australia for 2011.
| Product Group |
Australia Imports |
FTA Imports |
Percent of FTA Imports |
| Meat products, poultry, and edible animals |
1,254,080,086 |
5,929,051,956 |
21.15% |
| Finished metal shapes & advncd manuf, except steel |
662,965,345 |
6,465,097,275 |
10.25% |
| U.S. goods returned, and reimports |
604,500,065 |
16,325,594,455 |
3.70% |
| Wine and related products |
558,231,534 |
2,831,849,523 |
19.71% |
|
551,562,139 |
14,735,281,083 |
3.74% |
| Iron and steel mill products-semifinished |
531,904,897 |
7,399,011,402 |
7.19% |
| Nickel |
504,471,295 |
1,821,693,199 |
27.69% |
| Other scientific, medical and hospital equipment |
492,359,789 |
9,765,547,908 |
5.04% |
| Crude |
373,971,713 |
125,114,424,632 |
0.30% |
| Nuclear Fuel Materials and Fuels |
358,475,922 |
1,343,556,435 |
26.68% |
| Parts for civilian aircraft |
291,456,462 |
3,320,653,891 |
8.78% |
| Industrial inorganic chemicals |
288,600,292 |
2,819,306,751 |
10.24% |
| Steelmaking and ferroalloying materials-unmanufacd |
266,567,282 |
3,637,042,852 |
7.33% |
| Numismatic coins |
210,030,442 |
1,878,439,189 |
11.18% |
| Other (clocks, port typewriters, oth household gds |
208,455,992 |
16,848,119,313 |
1.24% |
| Feedstuff and foodgrains |
180,140,674 |
2,879,334,566 |
6.26% |
| Nonmonetary gold |
164,708,810 |
13,780,797,834 |
1.20% |
| Other parts and accessories |
156,842,330 |
43,142,205,742 |
0.36% |
| Other industrial machinery |
142,678,514 |
10,879,838,119 |
1.31% |
| Other precious metals |
116,490,882 |
7,256,480,592 |
1.61% |
Our top 20 exports5 to Australia are pleasing to look at, but these are deceptive also. When we look at what was imported from our other FTA partners and China, it is very blatant as to what we trans-shipped to Australia. This makes our export and GDP look very prosperous. That is not to say we aren’t exporting "Made in USA" or "Assembled in USA" products. Some of the partially or wholly "Made in USA" products would be excavating and agricultural equipment, toiletries and cosmetics, fertilizers and previously stated aircraft parts. What wasn’t made in the United States is easy to see; telecommunications, cars and parts, household goods and electrical apparatus, most of which would have come from Canada, China and Mexico. What makes these less valuable to the U.S. economy is that the products would have been held at a logistics facility at or near a port for exporting.
| Product Group |
Australia Exports |
FTA Exports |
Percent of FTA Exports |
| Materials handling equipment |
1,752,712,144 |
9,816,801,962 |
17.85% |
| Civilian aircraft, engines, equipment, and parts |
1,719,366,773 |
16,635,208,075 |
10.34% |
| Excavating machinery |
1,450,097,120 |
10,583,639,977 |
13.70% |
| Medicinal equipment |
1,142,759,705 |
8,641,382,598 |
13.22% |
| Minimum value shipments |
1,123,879,267 |
14,084,425,703 |
7.98% |
| Telecommunications equipment |
972,509,381 |
15,849,431,940 |
6.14% |
| Passenger cars, new and used |
909,470,688 |
19,154,245,716 |
4.75% |
| Industrial machines, other |
856,316,484 |
21,244,770,772 |
4.03% |
| Industrial engines |
822,555,261 |
11,938,874,755 |
6.89% |
| Agricultural machinery, equipment |
808,512,268 |
5,021,961,810 |
16.10% |
| Pharmaceutical preparations |
|
9,654,905,495 |
8.30% |
| Other household goods |
720,527,929 |
8,381,979,897 |
8.60% |
| Other parts and accessories of vehicles |
654,583,668 |
39,045,176,312 |
1.68% |
| Nonmonetary gold |
643,087,415 |
3,090,861,216 |
20.81% |
| Chemicals-organic |
474,739,329 |
14,010,110,215 |
3.39% |
| Electric apparatus |
463,383,773 |
21,267,718,818 |
2.18% |
| Chemicals-fertilizers |
462,896,635 |
4,224,142,568 |
10.96% |
| Petroleum products, other |
445,351,838 |
35,837,943,882 |
1.24% |
| Chemicals-other |
431,426,558 |
11,597,984,068 |
3.72% |
| Toiletries and cosmetics |
428,704,430 |
5,100,249,794 |
8.41% |
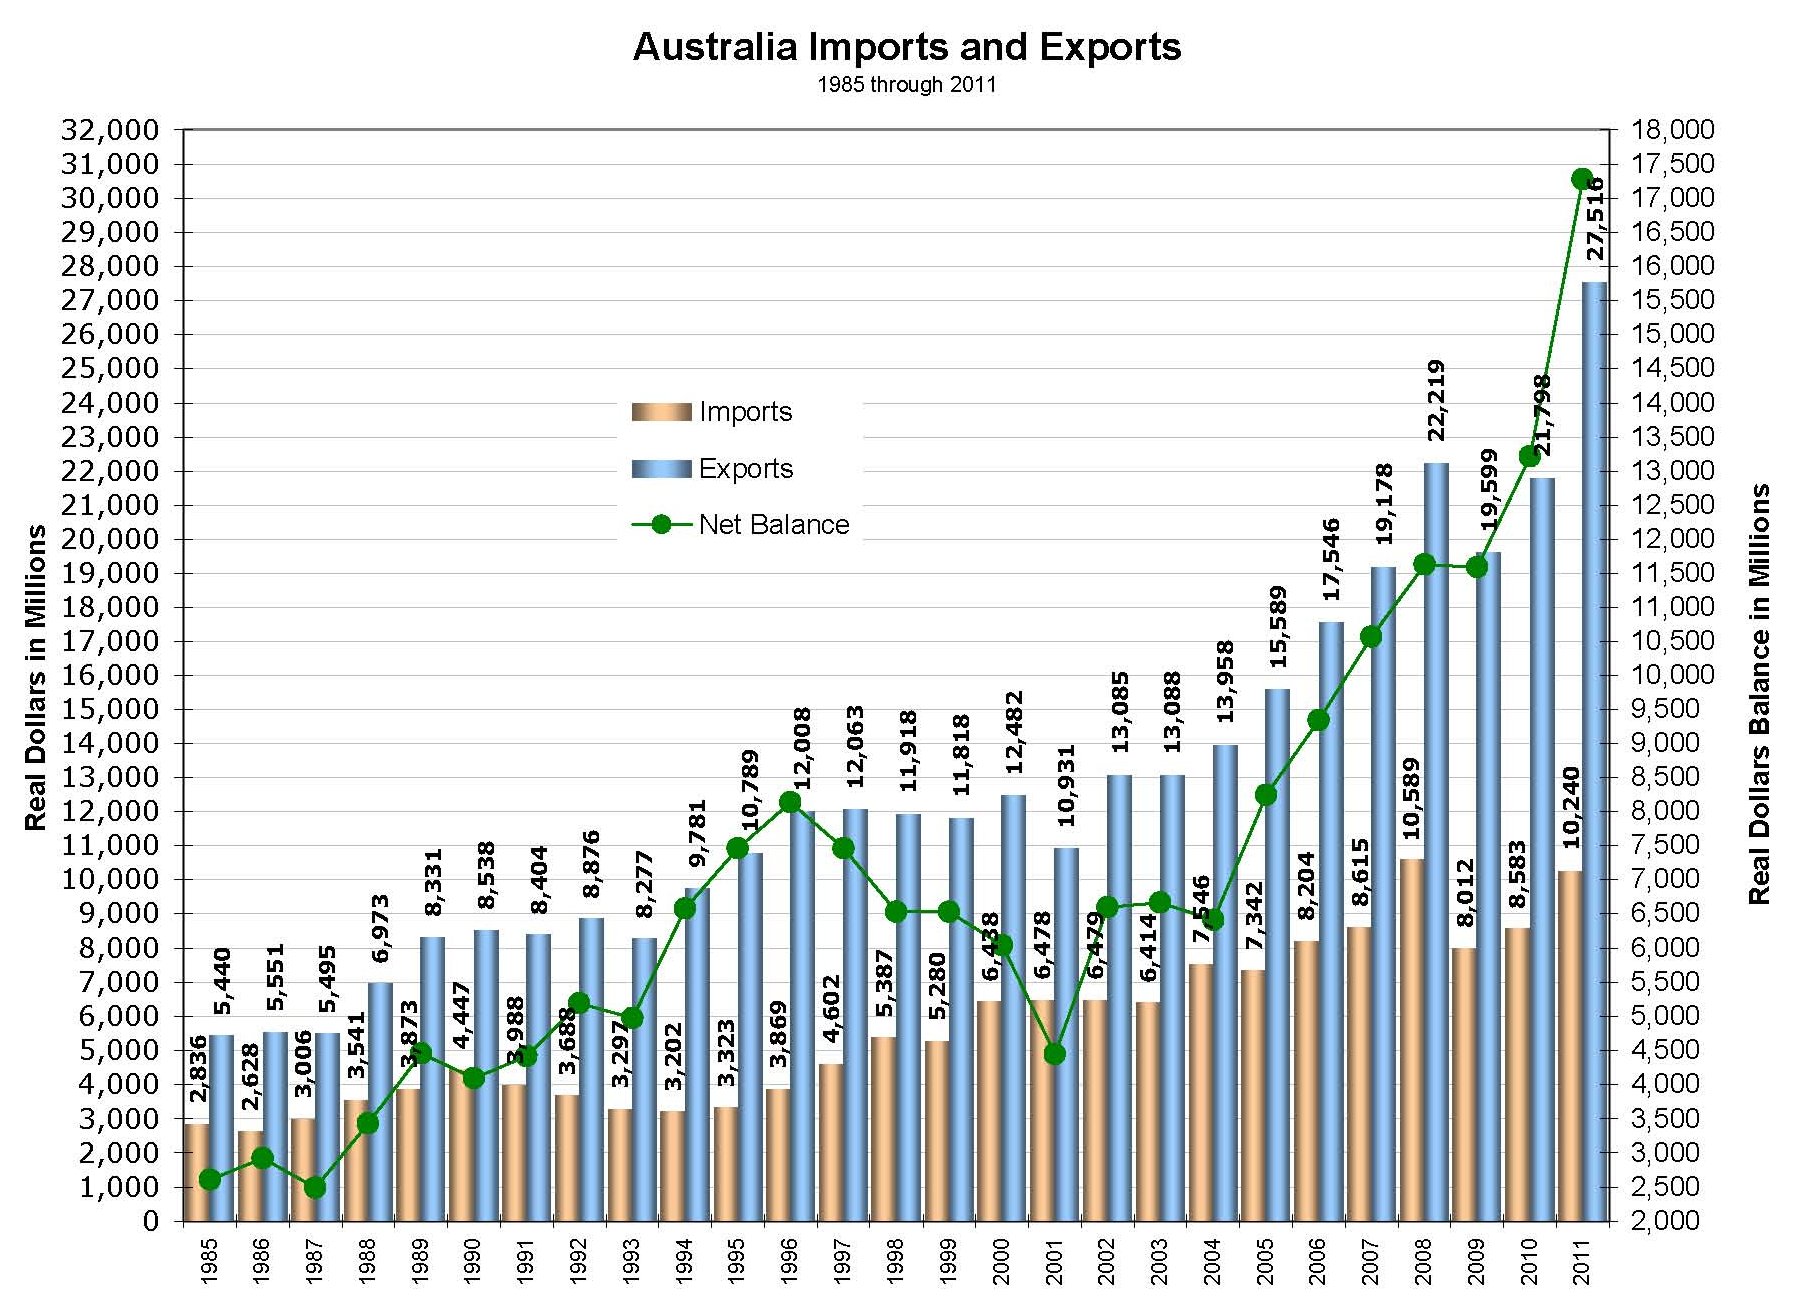
As previously stated, we have had a trade surplus with Australia since 1985. There have been two major spikes of exports to Australia; the first was from 1994 to 1996, followed by a major drop that extended through 2001. After a three year partial stabilization, starting in 2004 and continuing through 2011 our exports to Australia have increased dramatically year-over-year. Our exports of foreign made products to Australia contributed to keeping our overall trade deficits down. Had the American branded products actually been "Made in
USA", the U.S. manufacturing sector would still not be as strong as it was towards the end of the 1970’s.
We will continue to have a trade surplus with Australia provided the Trans-Pacific Partnership does not come to fruition. Because the of the geographically close proximity to Australia the countries with which the TPP will include will be able to trans-ship products through Australia, our trade surplus will become trade a deficit.
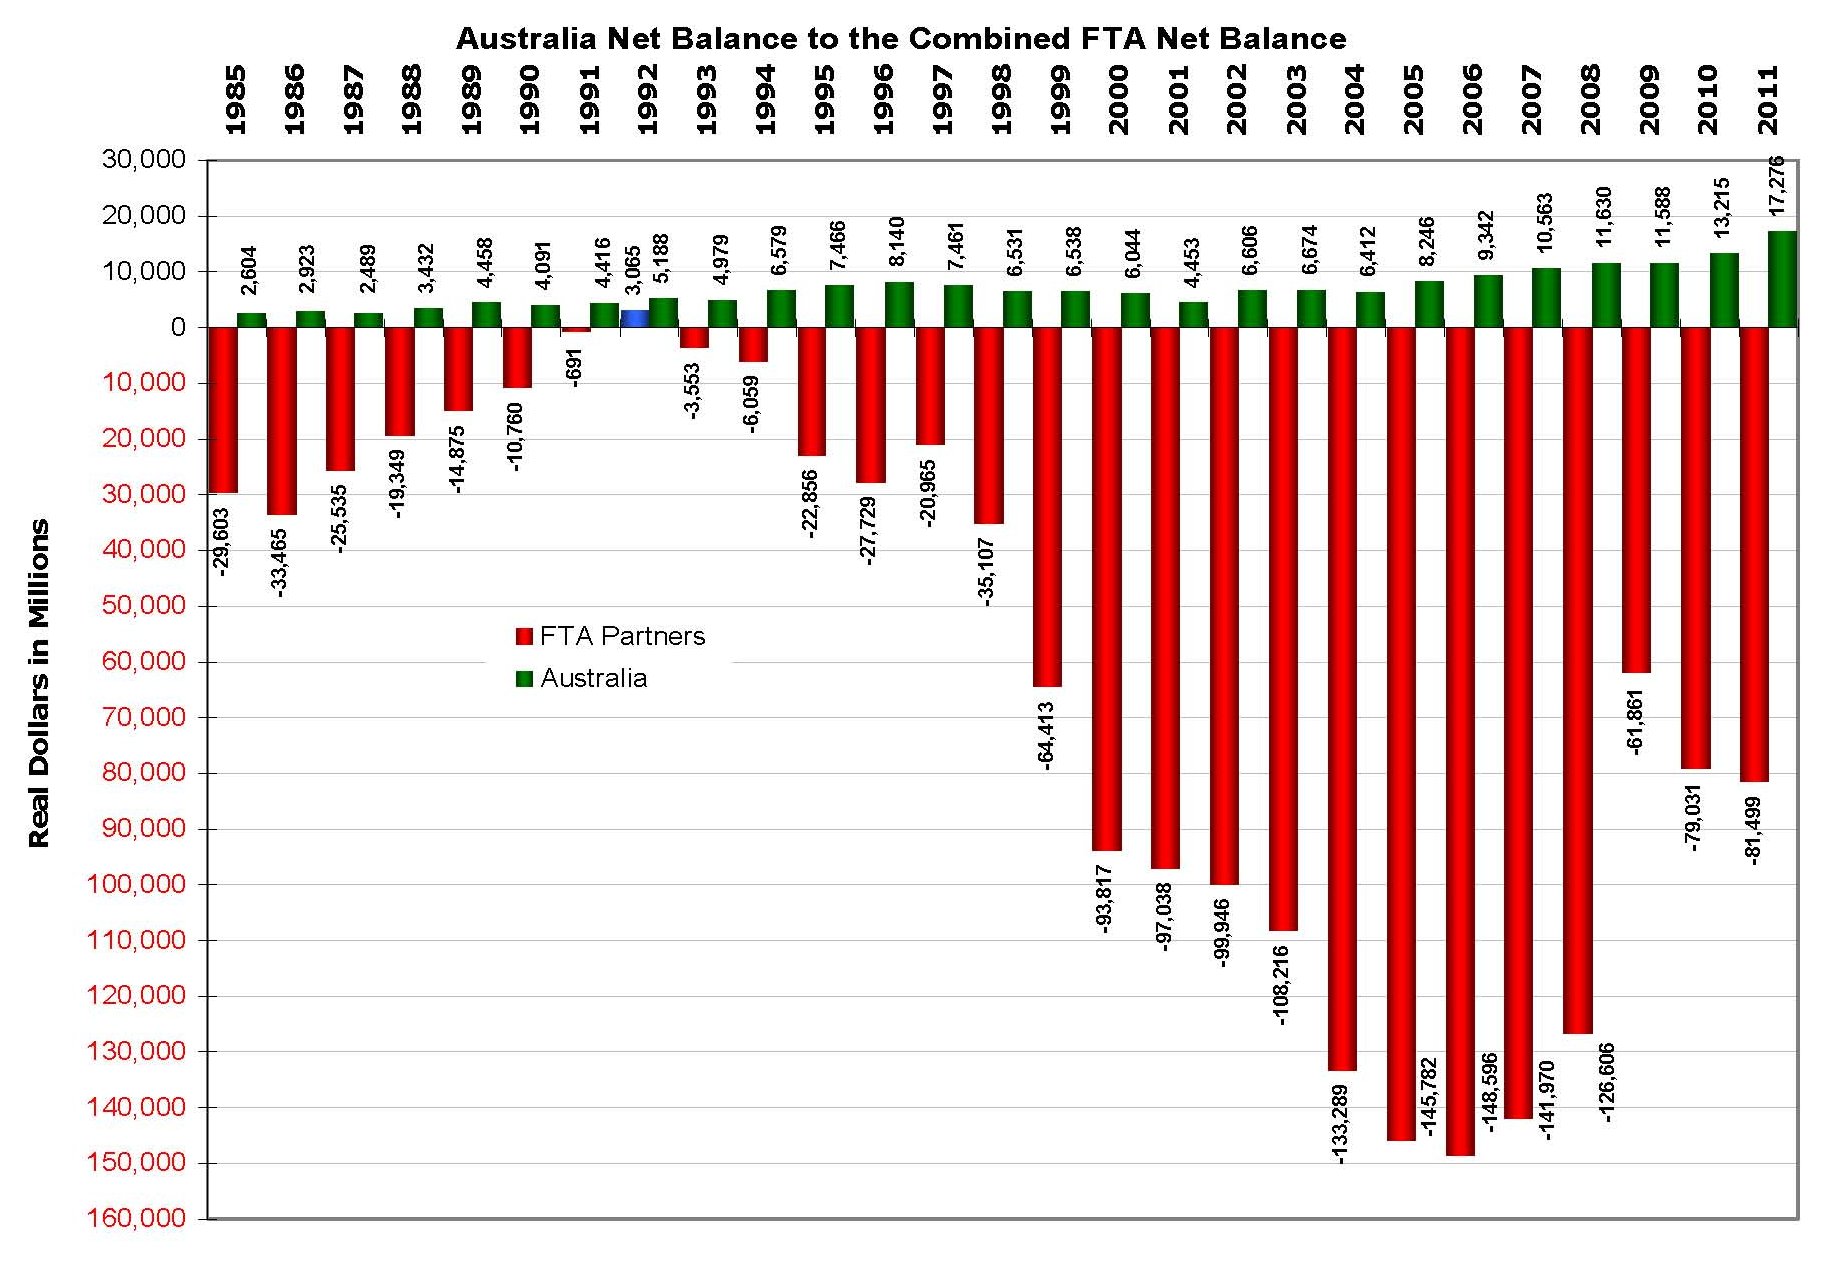
2011 marked the highest trade surplus with Australia at almost $17.3 billion, a $4 billion increase over 2010. Except for Singapore, no other country kept our FTA deficits down. If it weren’t for the surpluses with Australia, the years 1991 through 1994 would have had greater deficits; 1992 was our only year of a surplus with our FTA partners was due to the $5.2 billion surplus we had with Australia. No other FTA partner country will provide us with this amount of trade balance.
Click image for a larger view.
Import/export data for Global Trade can be obtained from:
Australian Bureau of Statistics.
Census Bureau - Foreign Trade.