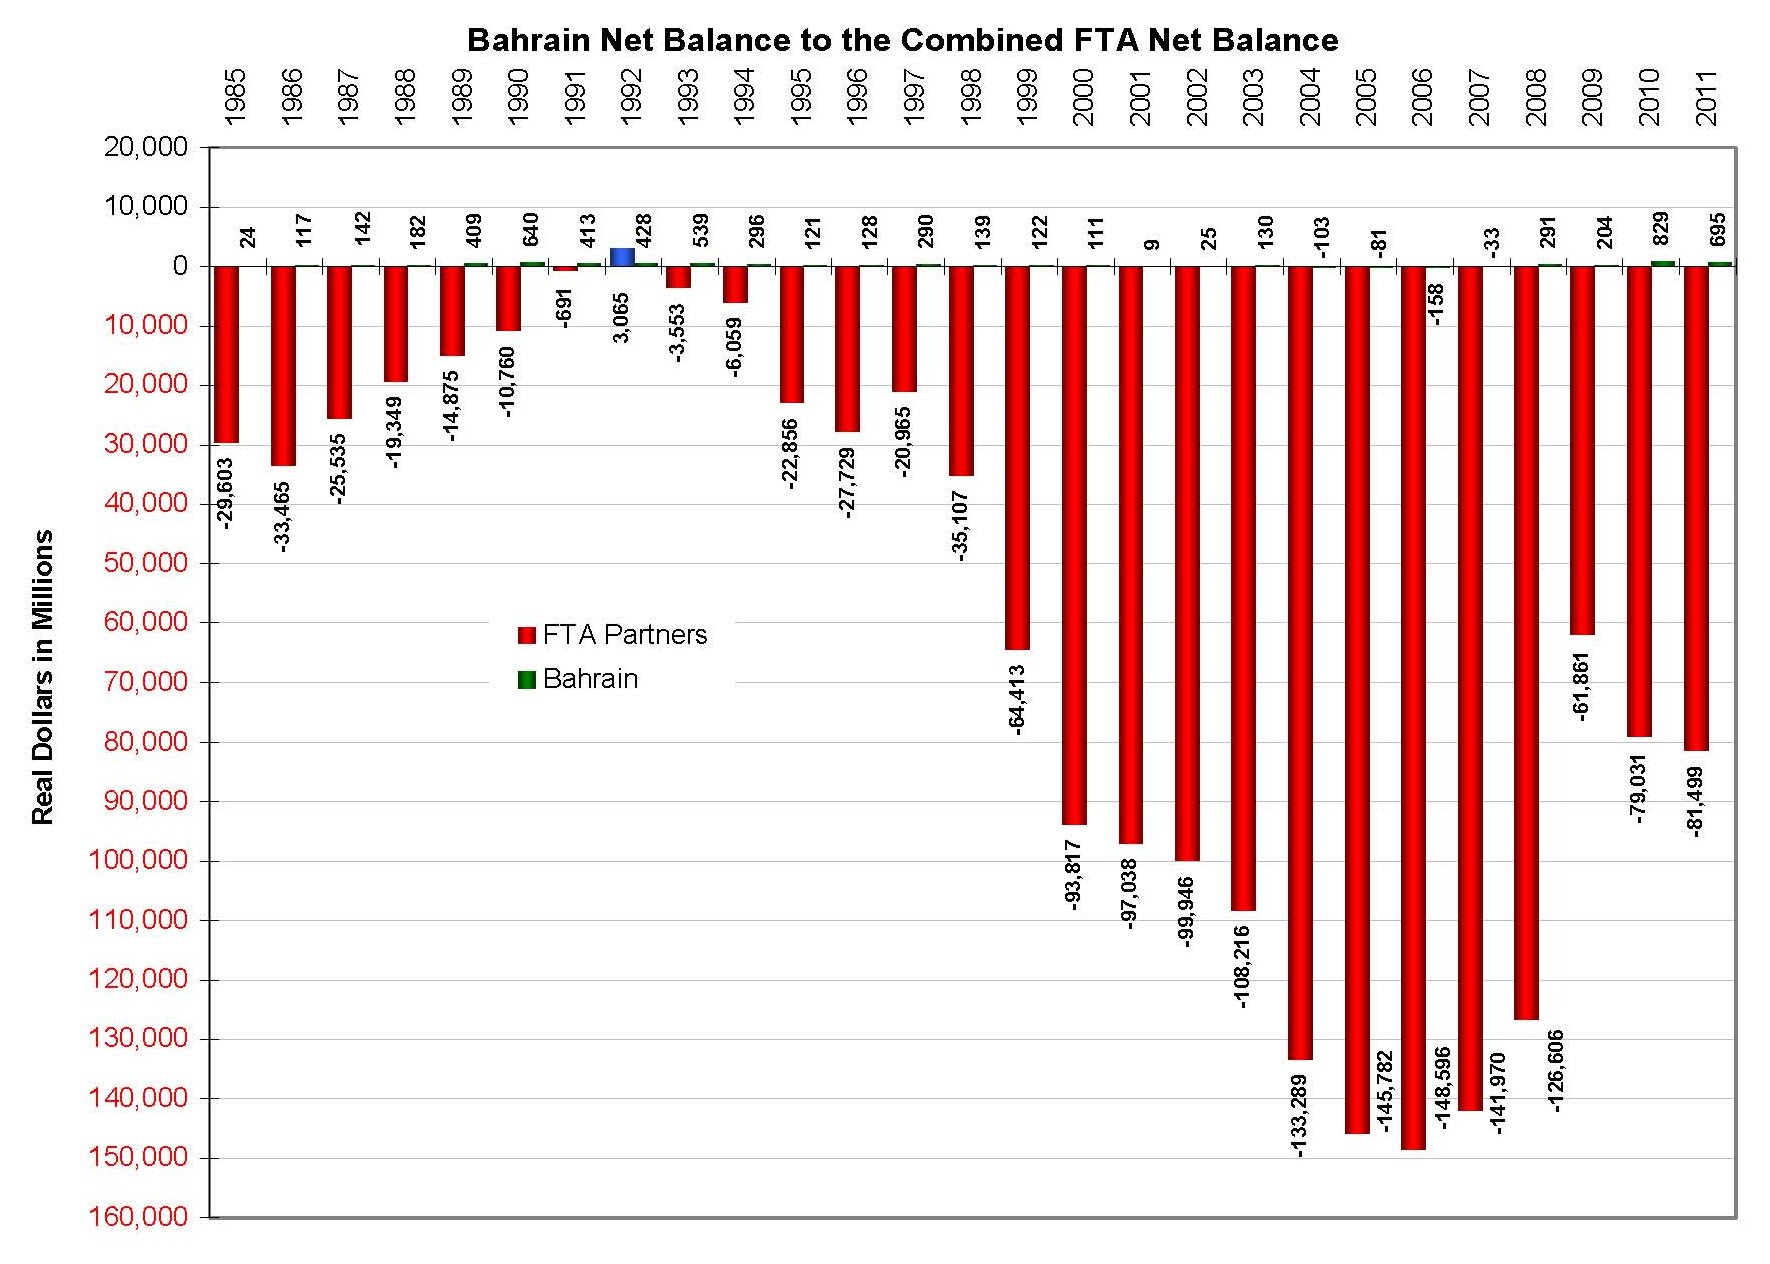
Our FTA with Bahrain started in 2006 and is one of five of our Free Trade Agreement partner countries in MENA; Middle Eastern North African. Our FTA with Bahrain is more about politics than economics, although economics is tied loosely to the politics and military; it is the U.S. Naval Forces Central Command. The political and social turmoil of Bahrain for the last six plus decades is not conducive to equal bilateral trade. Our actual imports and exports for the small island nation are almost negligible in relation to our total FTA trade balance for any year between 1985 and 2011. One of the most abundant commodities that Bahrain has is oil, which is not any of the products exported directly to the U.S. In fact, what we import and export is less than 1% for most products. When looking at the top 20 imports for 2011, it’s not hard to ascertain what was actually manufactured in Bahrain. Bahrain does not have enough manufacturing to export to countries with a large consumer base like the U.S. Most of what Bahrain would have imported into the U.S. came from other MENA countries and India.
| Product Group |
Bahrain Imports |
FTA Imports |
Percent of FTA Imports |
| Fertilizers, pesticides, and insecticides |
151,634,647 |
6,630,483,516 |
2.29% |
| Apparel and household goods-cotton |
138,670,998 |
9,157,784,740 |
1.51% |
| Bauxite and aluminum |
71,753,230 |
7,219,485,294 |
0.99% |
| Industrial organic chemicals |
48,267,653 |
6,964,210,407 |
0.69% |
| Apparel and household goods-other textiles |
35,792,823 |
5,864,279,108 |
0.61% |
| Finished metal shapes & advncd manuf, except steel |
26,192,358 |
6,465,097,275 |
0.41% |
| U.S. goods returned, and reimports |
19,668,382 |
16,325,594,455 |
0.12% |
| Other (movies, misc imports, and spec transactions |
7,707,653 |
2,099,233,136 |
0.37% |
| Woodworking, glass working, & plastic & rubber mch |
4,198,823 |
1,409,758,909 |
0.30% |
| Minimum value shipments |
2,240,633 |
4,896,067,953 |
0.05% |
| Cotton cloth and fabrics, thread & cordage |
1,631,281 |
263,712,699 |
0.62% |
| Jewelry (watches, rings, etc.) |
1,602,999 |
1,182,753,231 |
0.14% |
| Other (boxes, belting, glass, abrasives, etc.) |
1,348,061 |
10,331,019,050 |
0.01% |
| Synthetic cloth and fabrics, thread and cordage |
1,255,642 |
1,831,726,372 |
0.07% |
| Fish and shellfish |
1,135,694 |
4,866,763,735 |
0.02% |
| Other materials (hair, waste materials, etc.) |
1,129,091 |
256,400,742 |
0.44% |
| Parts for civilian aircraft |
763,501 |
3,320,653,891 |
0.02% |
| Iron and steel mill products-semifinished |
724,159 |
7,399,011,402 |
0.01% |
| Materials handling equipment |
596,933 |
3,600,054,090 |
0.02% |
| Sporting and camping apparel, footwear and gear |
347,492 |
526,734,364 |
0.07% |
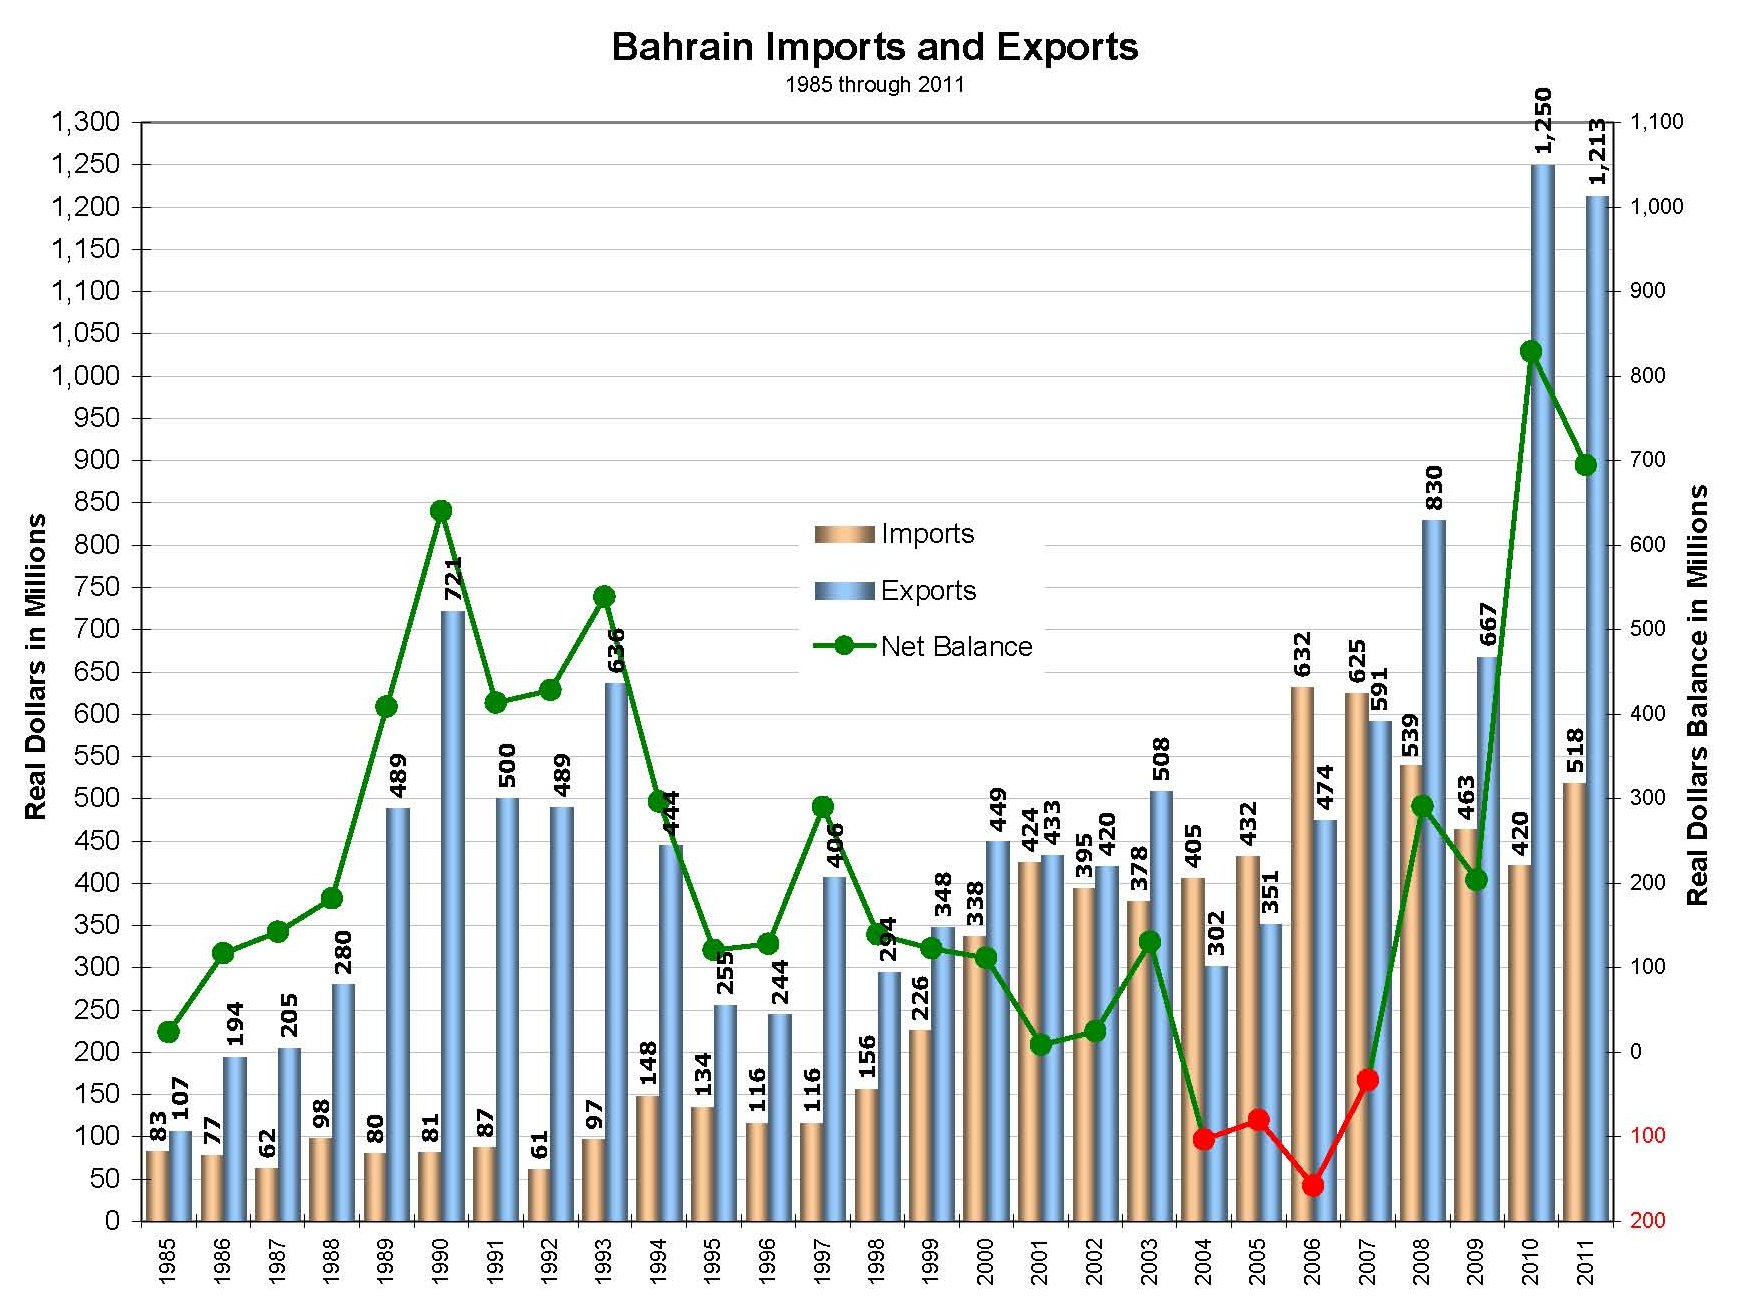
Exports fluctuated wildly through the 26 year period covered. These fluctuations coincided with the political situations in Bahrain. As the political environment improved or stabilized, exports increased, then visa-versa during unstable years. What was exported during the good years were equipment for oil production and surplus military supplies and equipment.
It is also important to note that of the finished products we exported to Bahrain many are high value and meant for the general public and the government.
By looking at the top 20 exports, our oil industry support for Bahrain is obvious. Some of what was imported would have been used in the oil industry and or converted for military use. Most of the military equipment is surplus rather than new. It is unfortunate also that most of the non-military products that were exported are not "Made in USA".
| Product Group |
Bahrain Exports |
FTA Exports |
Percent of FTA Exports |
| Civilian aircraft, engines, equipment, and parts |
213,163,220 |
16,635,208,075 |
1.28% |
| Minimum value shipments |
175,060,470 |
14,084,425,703 |
1.24% |
| Passenger cars, new and used |
128,181,601 |
19,154,245,716 |
0.67% |
| Drilling & oilfield equipment |
86,006,811 |
3,883,198,891 |
2.21% |
| Industrial engines |
75,819,848 |
11,938,874,755 |
0.64% |
| Industrial machines, other |
52,308,430 |
21,244,770,772 |
0.25% |
| Petroleum products, other |
27,962,339 |
35,837,943,882 |
0.08% |
| Wood, glass, plastic |
22,220,722 |
2,015,960,941 |
1.10% |
| Telecommunications equipment |
21,410,469 |
15,849,431,940 |
0.14% |
| Parts for military-type goods |
21,377,890 |
1,678,259,659 |
1.27% |
| Electric apparatus |
18,530,749 |
21,267,718,818 |
0.09% |
| Medicinal equipment |
17,660,821 |
8,641,382,598 |
0.20% |
| Measuring, testing, control instruments |
16,165,248 |
9,251,456,614 |
0.17% |
| Trucks, buses and special purpose vehicles |
15,758,110 |
15,785,832,823 |
0.10% |
| Photo, service industry machinery |
13,386,785 |
5,136,024,340 |
0.26% |
| Plastic materials |
13,375,320 |
18,408,120,336 |
0.07% |
| Aircraft launching gear, parachutes, etc. |
13,309,962 |
68,886,909 |
19.32% |
| Toys/games/sporting goods |
12,851,840 |
5,662,852,923 |
0.23% |
| Chemicals-other |
12,511,838 |
11,597,984,068 |
0.11% |
| Other foods |
12,108,807 |
6,496,089,327 |
0.19% |
We have had a trade surplus with Bahrain every year except for the four years from 2003 through 2007. Through those four years though, the highest deficit barely hit $158 million in 2006. Our best year of trade was 2010 with a net surplus of a little over $829 million.
Between 1985 and 1998 imports from Bahrain remained relatively stable year-over-year.
From 1999 to 2011 imports fluctuated without consistency.
Click image for a larger view.
Import/export data for Global Trade can be obtained from:
Census Bureau - Foreign Trade.