After tariff negations the Costa Rica became part of the CAFTA-DR and active in 2009.
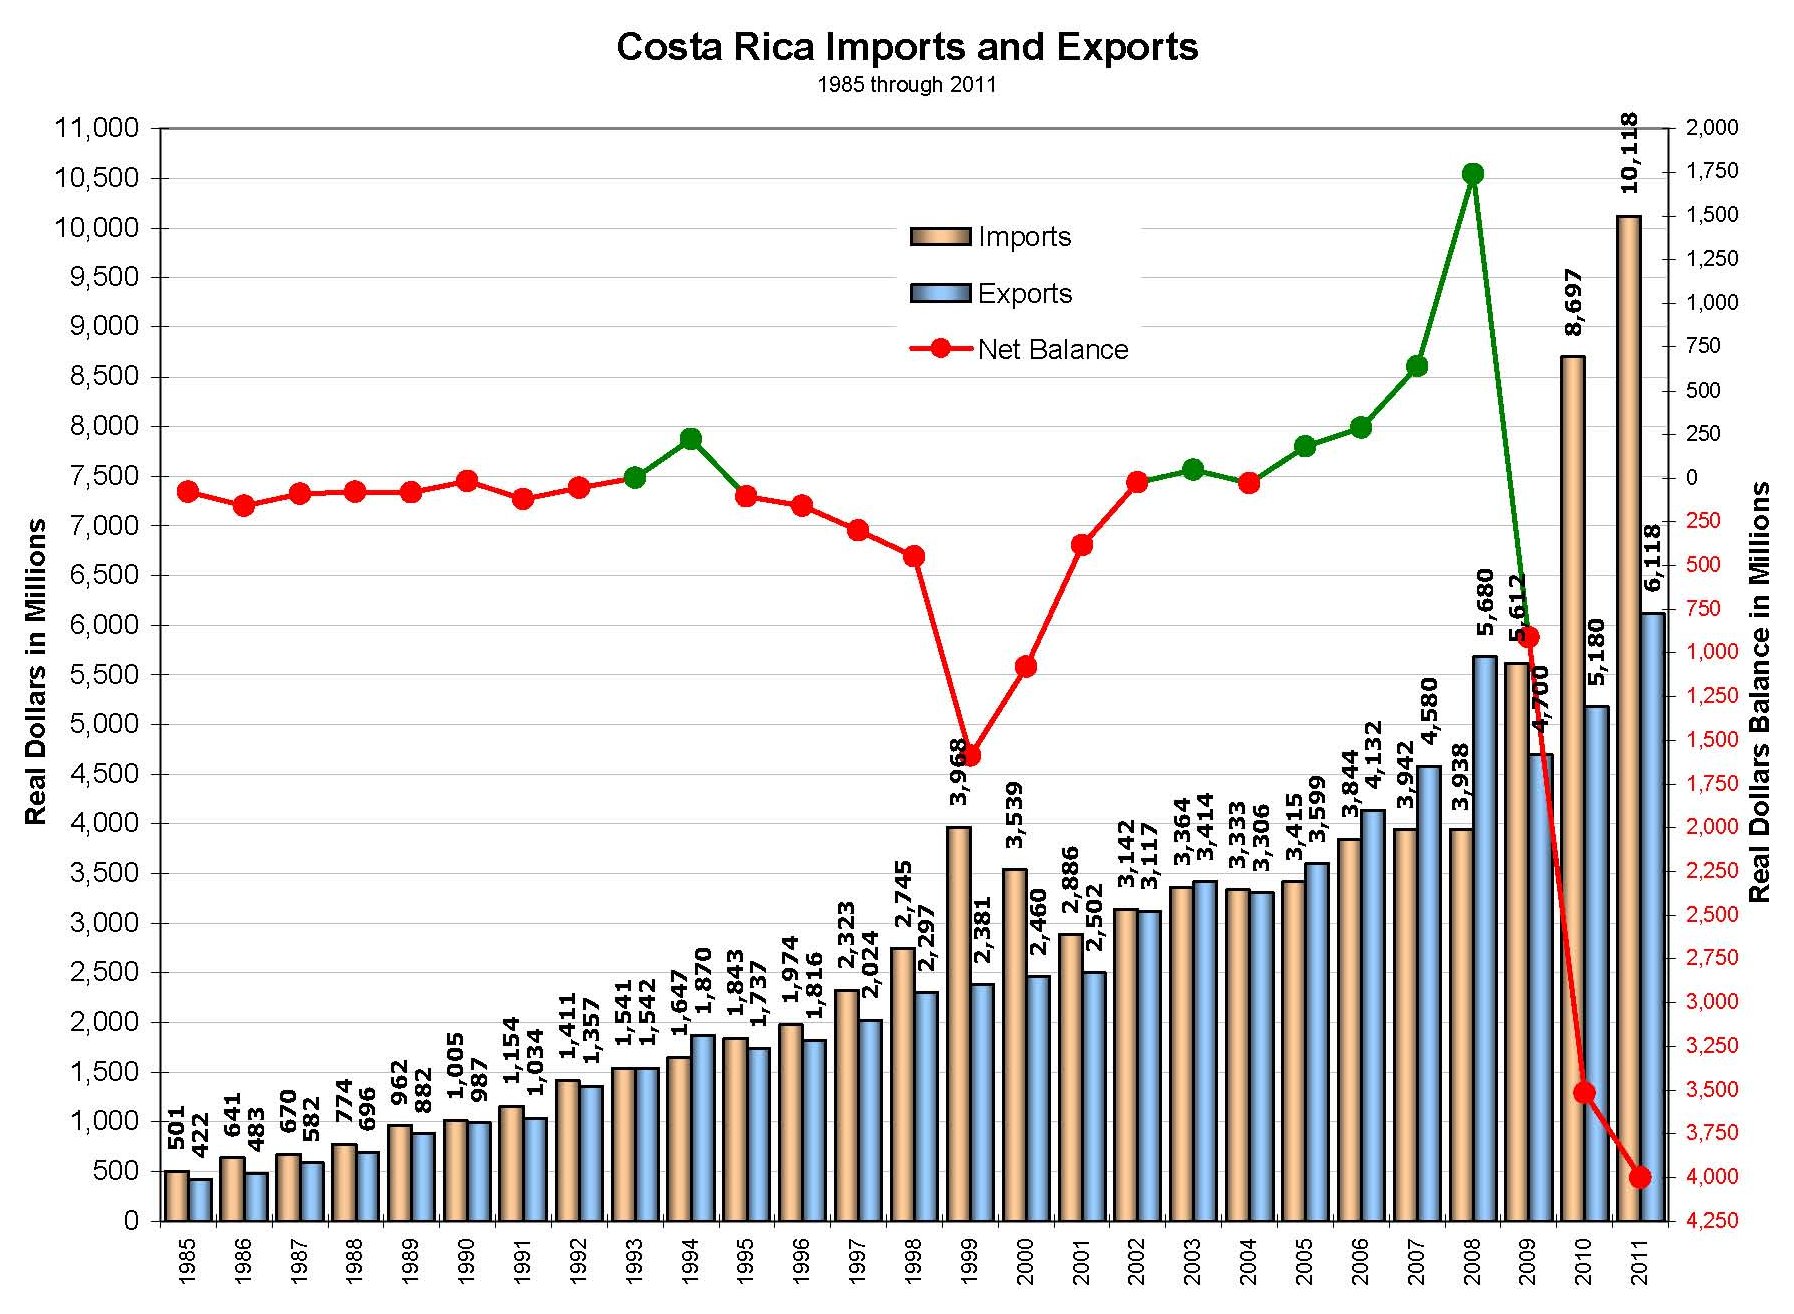
According to the U.S. Department of State, Costa Rica relies heavily on tourism and commerce for 71% of its GDP. As part of the total estimated 2010 GDP of $35.78 billion, imports to the U.S. would have accounted for almost 30% with $10.1 billion worth of mostly American products. With an average 2010 income of about $11,300 for the working population, most American brand products are outside the economic reach for the general population. The 2011 population was almost 4.58 million with less than half, 2.05 million, in the workforce. Of the top 20 we imported almost $1.5 billion worth of food and agricultural products; fruits, vegetables, coffee, seafood and decorative floral, some of these are not indigenous to the U.S; many of the American products we imported were computer components and accessories, tires, clothing and household goods.
| Product Group |
Costa Rica Imports |
CAFTA-DR Imports |
Percent of CAFTA-DR Imports |
| Semiconductors and related devices |
6,176,583,746 |
6,187,260,223 |
99.83% |
| Fruits and preparations, including frozen juices |
916,715,075 |
2,021,255,429 |
45.35% |
| Other scientific, medical and hospital equipment |
709,902,429 |
1,294,016,473 |
54.86% |
| Green coffee |
251,808,127 |
1,486,369,899 |
16.94% |
| Computer accessories, peripherals and parts |
187,663,986 |
193,981,157 |
96.74% |
| Other (clocks, port typewriters, other household goods |
178,080,609 |
245,479,937 |
72.54% |
| Minimum value shipments |
170,559,294 |
251,152,250 |
67.91% |
| Electric apparatus and parts, n.e.c. |
169,962,516 |
595,444,514 |
28.54% |
| U.S. goods returned, and reimports |
118,147,591 |
391,886,553 |
30.15% |
| Automotive tires and tubes |
117,493,082 |
117,493,082 |
100.00% |
| Apparel and household goods-cotton |
110,588,731 |
5,230,001,844 |
2.11% |
| Vegetables and preparations |
93,209,291 |
373,109,588 |
24.98% |
| Other (boxes, belting, glass, abrasives, etc.) |
82,656,785 |
180,181,066 |
45.87% |
| Fish and shellfish |
73,242,698 |
392,155,533 |
18.68% |
| Telecommunications equipment |
71,488,262 |
83,469,296 |
85.65% |
| Nonmonetary gold |
62,316,965 |
1,039,523,048 |
5.99% |
| Nursery stock, cut flowers, Christmas trees |
54,852,538 |
97,858,837 |
56.05% |
| Cane and beet sugar |
52,432,916 |
447,609,374 |
11.71% |
| Apparel and household goods-other textiles |
51,443,907 |
2,661,126,446 |
1.93% |
| Other parts and accessories |
41,999,804 |
904,390,351 |
4.64% |
We exported a mix of finished, semi-finished and raw materials and products to Costa Rica, most of what we exported was then imported as American brand products from other countries. Relative to the CAFTA-DR percentages, Costa Rica received the lion’s share of many products.
Only four of the 20 top products were meant for direct consumer purchasing; telecommunications, computers and accessories and cars. Of these four consumer products, about half would have been for government use. The most expensive of these would be cars; very few relative to the population were actually shipped to Costa Rica, only about 3,000 to 5,000 depending on the retail cost. Including cars, almost everything exported to Costa Rica was trans-shipped from other countries. The industrial supplies and equipment were sent to Costa Rica for manufacturing American products, some of which were also trans-shipped from Asia and other South and Central American countries.
| Product Group |
Country Exports |
FTA Exports |
Percent of FTA Exports |
| Petroleum products, other |
742,557,594 |
3,133,199,262 |
23.70% |
| Fuel oil |
726,599,976 |
3,411,800,615 |
21.30% |
| Semiconductors |
667,881,064 |
716,914,891 |
93.16% |
| Plastic materials |
276,960,940 |
912,741,465 |
30.34% |
| Minimum value shipments |
237,341,183 |
1,084,232,286 |
21.89% |
| Corn |
205,114,063 |
1,008,552,250 |
20.34% |
| Medicinal equipment |
183,174,701 |
493,673,110 |
37.10% |
| Newsprint |
181,720,851 |
735,282,691 |
24.71% |
| Telecommunications equipment |
161,365,747 |
405,185,922 |
39.83% |
| Electric apparatus |
153,948,338 |
809,524,419 |
19.02% |
| Computers |
123,553,010 |
341,210,732 |
36.21% |
| Computer accessories |
122,675,706 |
472,652,152 |
25.95% |
| Other household goods |
121,874,807 |
415,574,158 |
29.33% |
| Soybeans |
117,875,802 |
139,458,432 |
84.52% |
| Other industrial supplies |
112,078,218 |
479,257,119 |
23.39% |
| Chemicals-fertilizers |
104,988,273 |
364,726,607 |
28.79% |
|
94,488,181 |
623,627,082 |
15.15% |
| Finished metal shapes |
92,006,756 |
239,366,019 |
38.44% |
| Measuring, testing, control instruments |
91,545,092 |
172,394,192 |
53.10% |
| Chemicals-other |
86,348,819 |
338,578,669 |
25.50% |
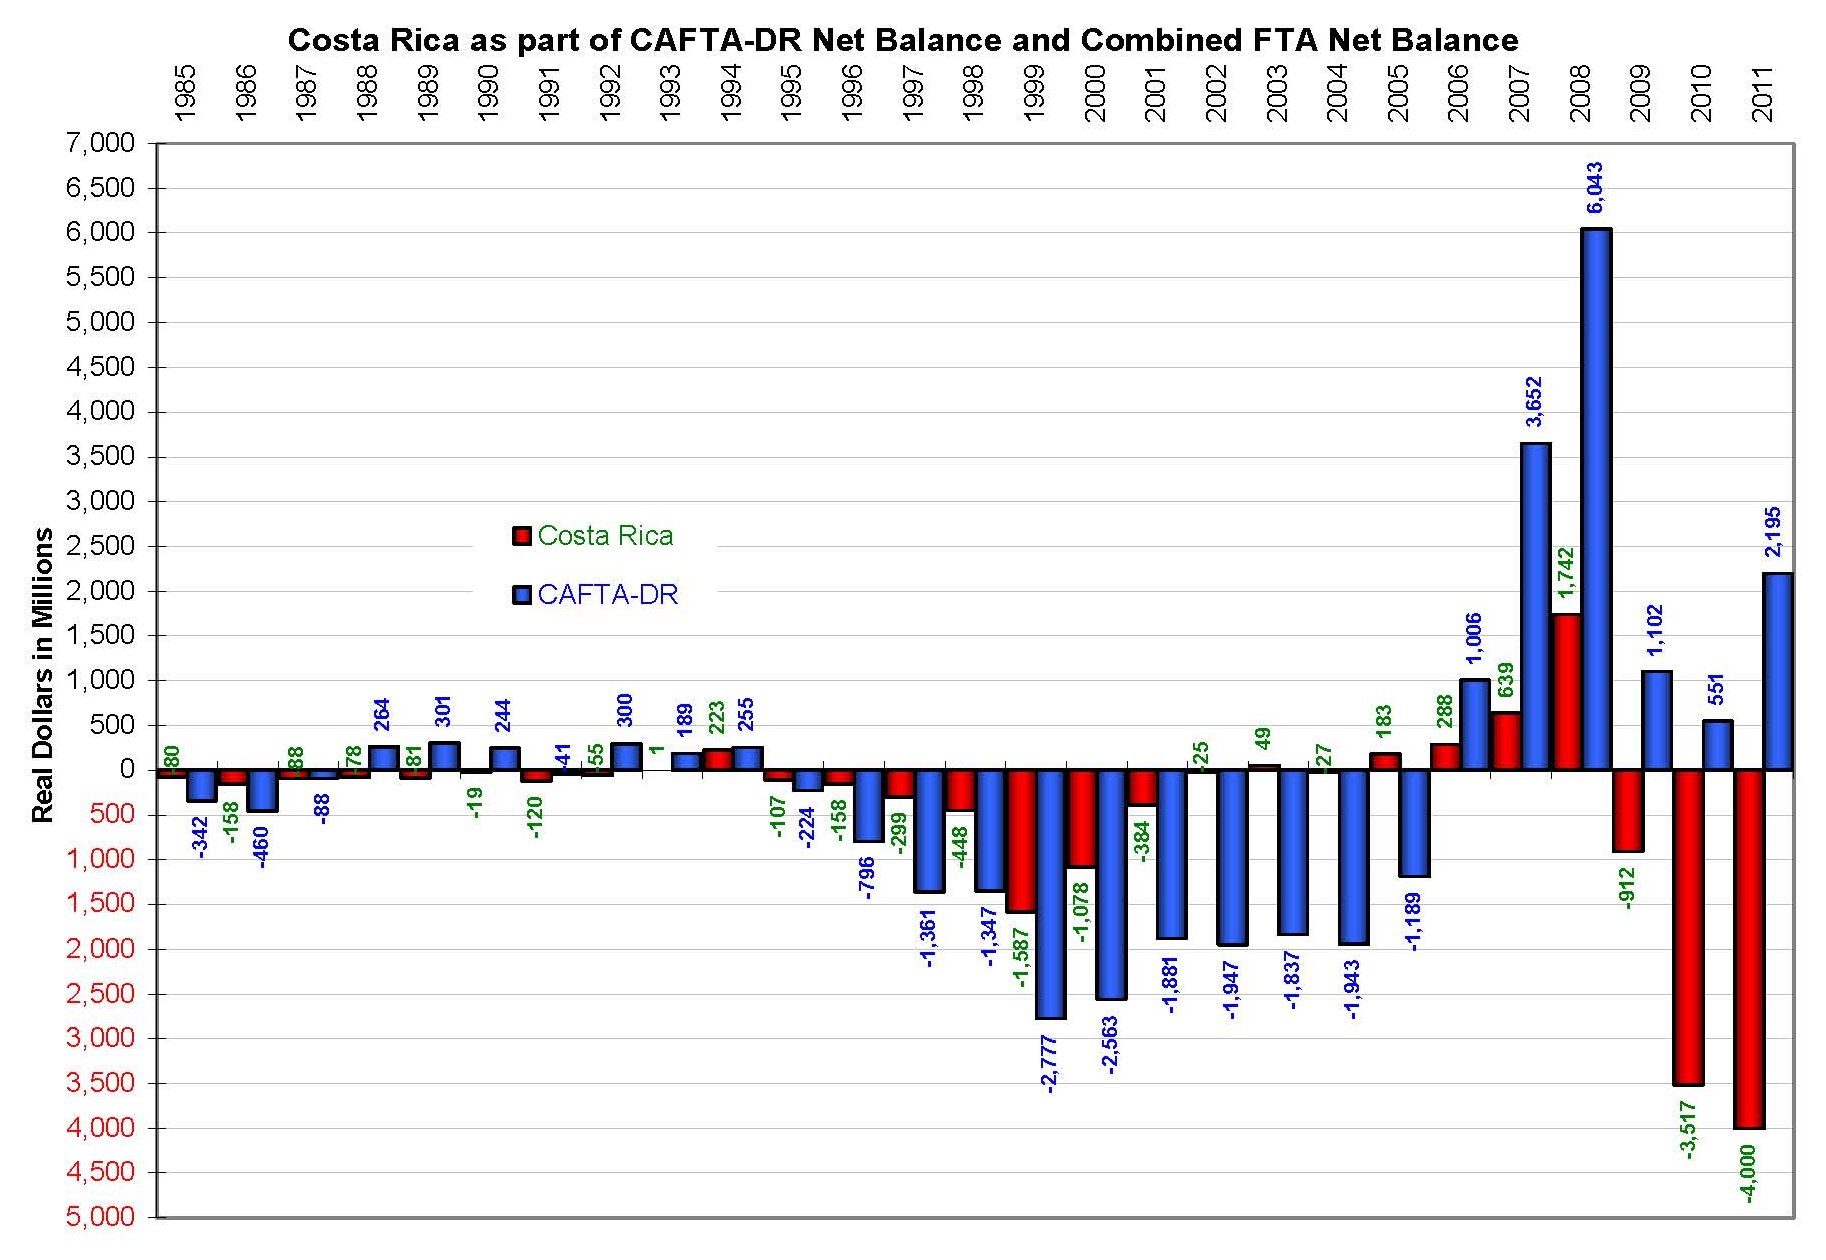
With the exception of seven years from 1985 to 2011 we have had a trade deficit with Costa Rica; the best year being 2008 with a trade surplus of almost $1.75 billion. As with most of our trade agreements, we end each year with minor surpluses or very deep deficits. There is no exception with the CAFTA-DR and Costa Rica. Costa Rica is the largest of the trade partners in terms of total dollar values within the CAFTA-DR. At the end of 2011, the U.S. secured a $4 billion deficit with Costa Rica.
Click image for a larger view.
Import/export data for Global Trade can be obtained from:
Census Bureau - Foreign Trade.
Department of State - U.S. Relations With Costa Rica.