These are the 20 countries with which we have the Free Trade Agreements with and the years in which the agreements started.
| Country |
Year |
Country |
Year |
| Australia |
2005 |
Israel |
1985 |
| Bahrain |
2006 |
Jordan |
2010 |
| Canada |
1994 |
Mexico |
1994 |
| Chile |
2004 |
Morocco |
2006 |
| Colombia |
2012 |
Nicaragua |
2006 |
| Costa Rica |
2009 |
Oman |
2009 |
| Dominican Republic |
2007 |
Panama |
2012 |
| El Salvador |
2006 |
Peru |
2009 |
| Guatemala |
2006 |
Singapore |
2004 |
| Honduras |
2006 |
South Korea |
2012 |
The most well known Free Trade Agreements is NAFTA. Many Americans may not be aware that we are in active FTAs with 18 other countries; on October 12, 2011 Congress ratified three more FTAs, and China waiting in the wings and one in active negotiations. The Free
Trade Agreements did not create the present economic situation of the United States; however, with the recession that started in 2007 and the financial sector crash of 2008, the Free Trade Agreements have assisted in the continued stagnation of the economy.
Having gone over China first and separately was important because of the effect of trade balances it has on our economy global economic standing. China is not included in this part, because it is not yet an active FTA partner. The Trans-Pacific Partnership is not included in this part as that trade agreement is still in negotiations; however Australia, Chile, Peru and Singapore are part of TPP. The TPP will further weaken the economy as more American jobs will move offshore, as manufacturing jobs are eliminated so will the supporting jobs are eliminated and local economies will continue to remain stagnant. Because of tax breaks, our net trade deficits continue and will continue to increase in relation to the value of these tax breaks. As long as Congress blatantly refuses to recognize this as fact, our economy will never recover. Because of the absence of import tariffs, absolutely all tax breaks related to foreign operations of U.S. companies must be eliminated, this is to include any and all customs expenses. Expenses incurred in the U.S. should be the only allowance provided as standard business expenses, including the costs of compliance of U.S. regulations.
The one major flaw in the Free Trade Agreements, for all of them, is the fact that receiving partner countries are not required to import "Made in USA" products, only that the product be made by a U.S. corporation. One of the major hurdles eliminated by the Free Trade Agreements were the relaxed requirement of business presence. Business presence meant that the company was required to have a fully functioning office and self-owned manufacturing facilities within the country of business. Now U.S. based corporations do not need any other business presence of any type in these countries. This means that U.S. based corporations can have contracted manufacturing facilities in the partner country; this is one of the contributing factors to high unemployment rates in the U.S. manufacturing sector.
It should be understood, import tariffs are applied to foreign based corporations at all times, except those with operations in FTA partner countries no matter the home country of that company. If, for example, a company is based in England, but has a manufacturing or processing facility, direct or contracted, in Canada, those products are allowed in the U.S. tariff free. This does not have an effect on our trade balance with England; it does have an effect on our trade balance with Canada.
Of the 20 countries we have free trade with, none were no more important to U.S. manufacturers than South Korea and Colombia. South Korea is important as there are several of their electronic and appliance manufacturers that import from South Korea. Colombia was important because it is a tax haven, and the Free Trade Agreement did nothing to alleviate that. Most of the Free Trade Agreements were raced through Congress with almost no public input. After seeing the failure of NAFTA, President Bush and Congress made the Free Trade Agreements ratified during the Bush administration without the pomp and circumstance given NAFTA and the three ratified in 2011 to start in 2012.
Members of Congress and the President are very aware of the employment losses because of these trade agreements. The Trade Adjustment Assistance Program, a program through the Department of Labor, an assistance program to help Americans that have lost their job due to these trade agreements, helped over 196,000 Americans in fiscal year 2011 at a cost of just over $702 million by this program.
Although this will be addressed further in the "Employment" section, according to the U.S. Trade Representative, "Every $1 billion in new exports of American goods supports more than 6,000 additional jobs here at home. Every billion dollars of services exports supports more than 4,500 jobs." By that reasoning and using that same calculation for American products imported to the U.S., 489,000 Americans are unemployed because of the 2011 trade deficits created by the Free Trade Agreements. For our total global net trade deficit for 2011 would amount to a net of 4,357,738 jobs not occupied by Americans. Our FTA trade deficits are from a failure of Congress either not considering or blatantly ignoring the actual economic and employment effects of our trade agreements.
As long as Congress and ex-patriot U.S. based corporations continue to abandon the American economy and the American worker, our trade deficits will continue to rise. Some members of Congress have turned taxing U.S. corporations into taxing the personal wealth of the highest income earners in America. Another group of Congressmen want to increase taxes on stay-at-home American businesses; neither is willing to tax American brand products made abroad. In an effort to retain campaign and party contributions from ex-patriot, American based corporations most members of Congress and both parties will never send a bill to the President that will start to tax imports.
A careful look at what domestic and foreign companies and lobbyists that contribute to the campaigns and the parties will demonstrate why the import tariffs and foreign earned income will never be taxed. Most of these companies will contribute more to the campaigns then they pay in income taxes to stop any effort to tax imported products. Worse than a drug addict, these House and Senate Representatives are so addicted that they have traded the livelihoods of over 4 million Americans to get elected and get re-elected.
None of our FTA partners have industries of their own. From automotive to washing machines, all were invented or technologically developed in the United States in the last 100 years or more. American corporations started exporting the technologies and manufacturing concepts in the 1950s and 1960s by the 1980s these corporations started exporting manufacturing jobs faster than actual products.
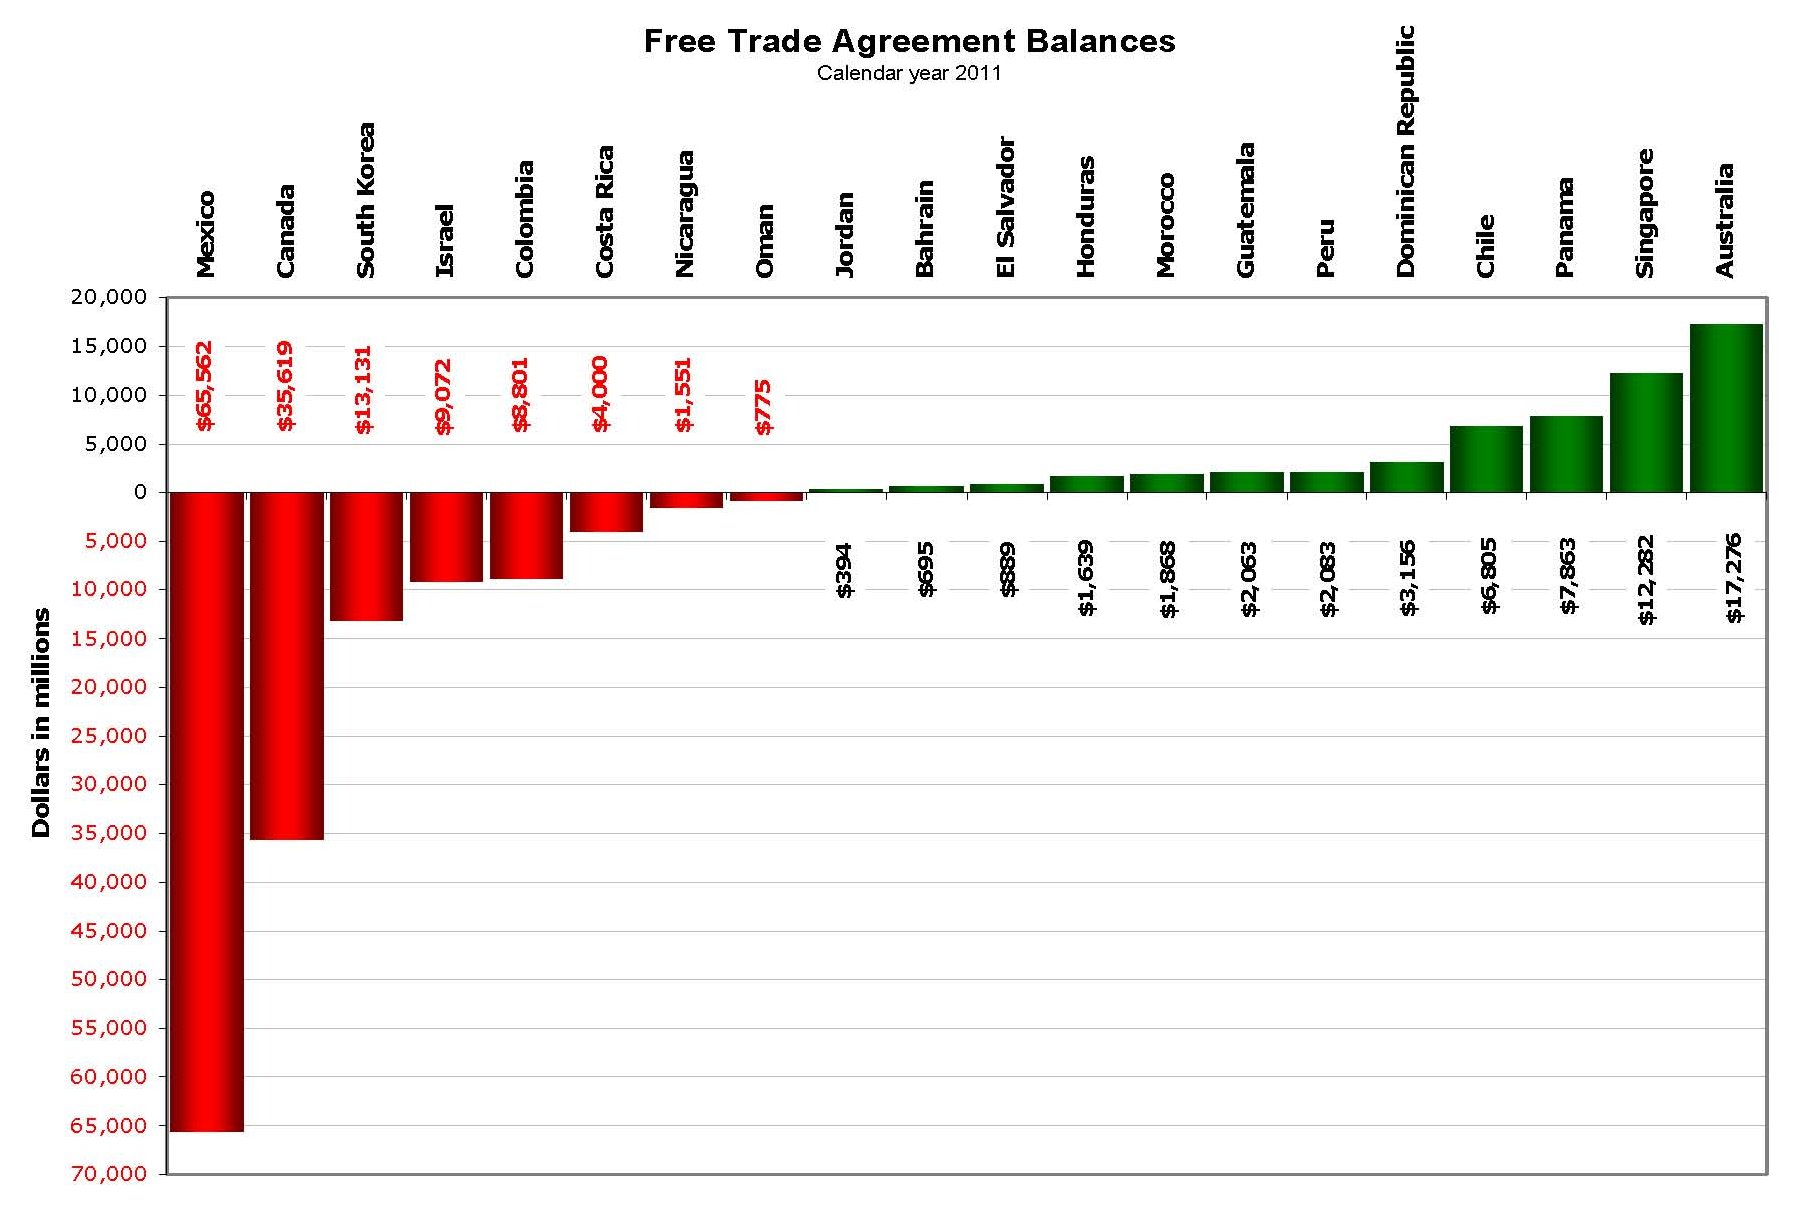
How much we imported from all of our FTA partner countries is just as important as how much we exported to them. Balances in red are deficits. At the end of 2011 the U.S. had a net trade deficit with eight of the 20 countries with which we have Free Trade Agreements.
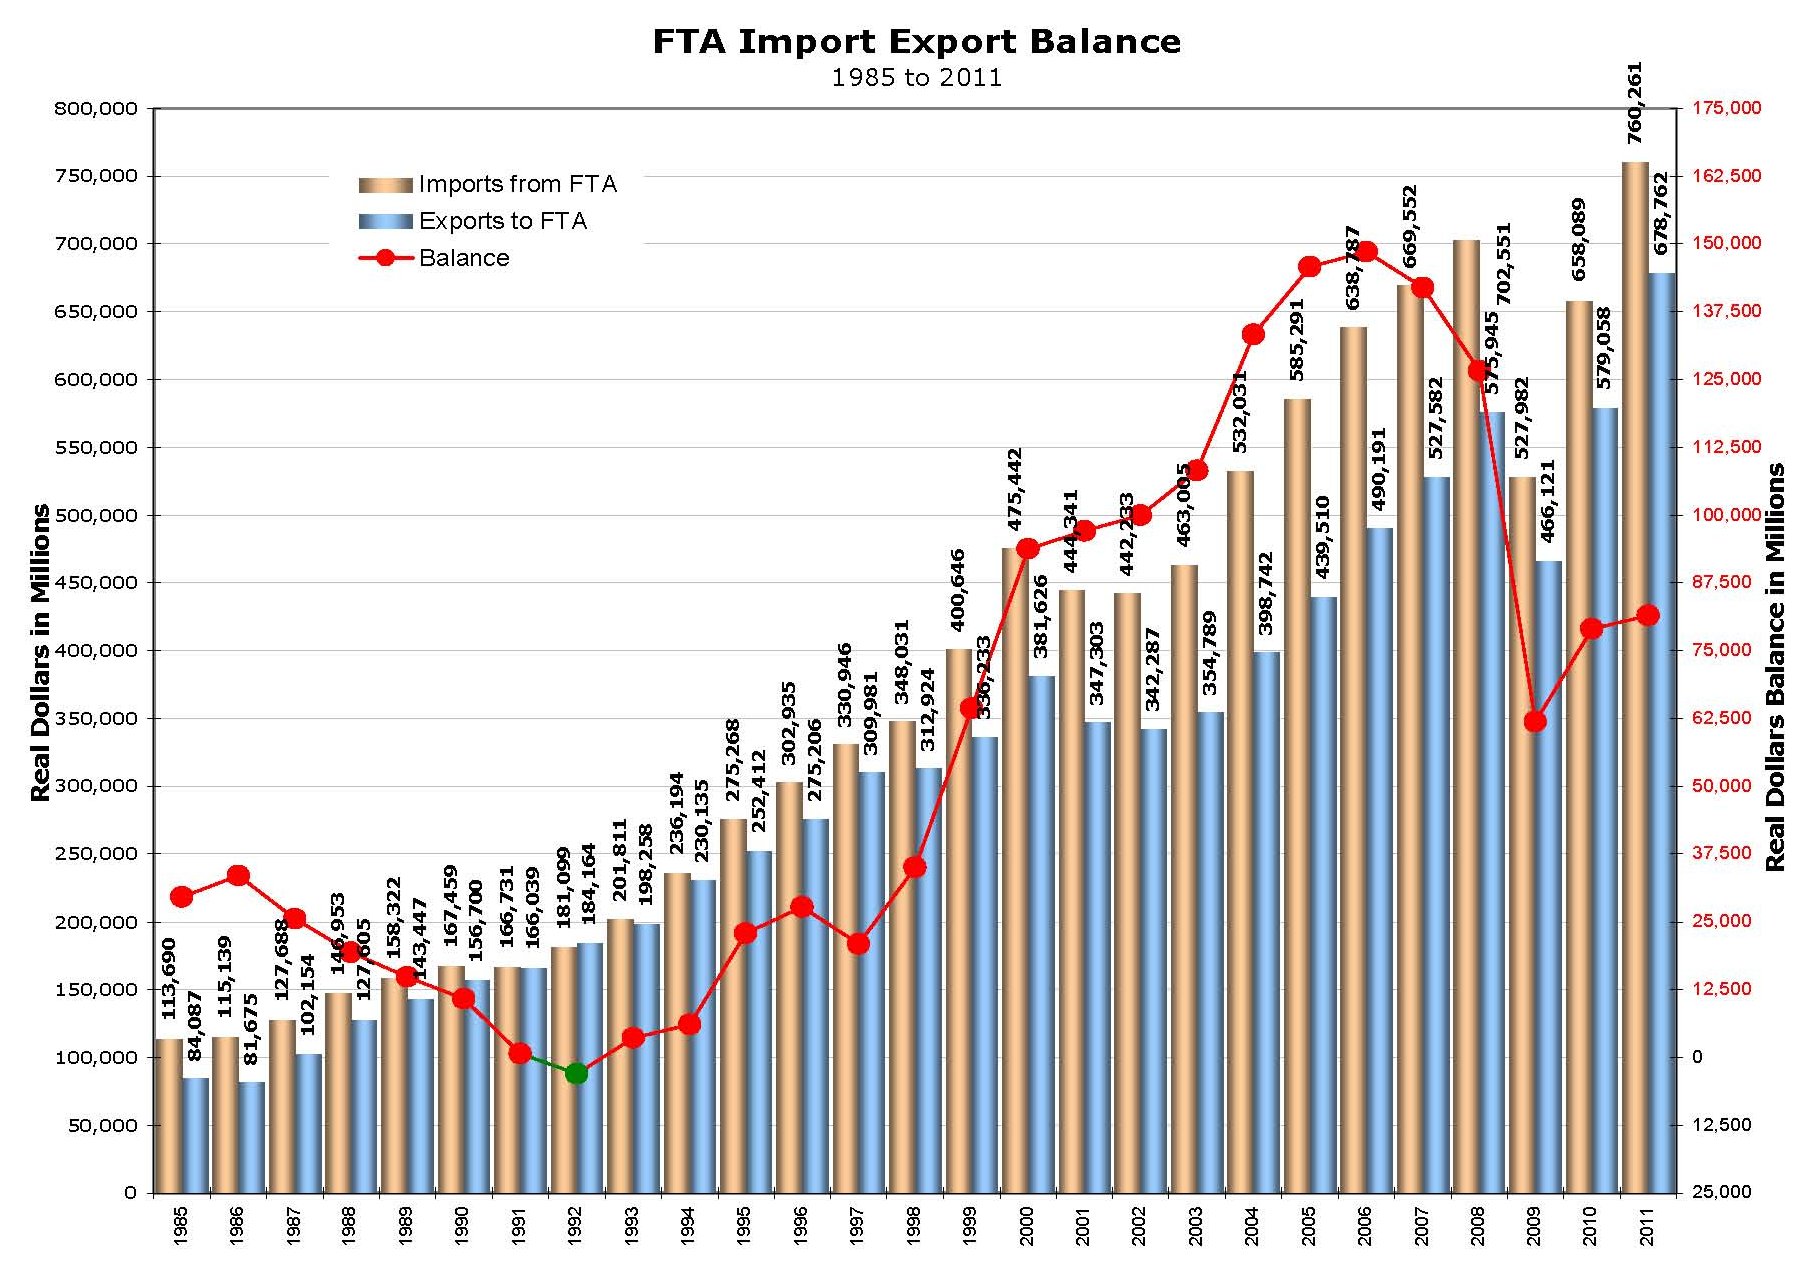
Our 2011 net trade deficit with those eight countries was $433,967,640,066. The 12 countries that we have trade surpluses with total $57,012,160,259; this is almost $8.6 billion less than our net deficit with Mexico $65,562,128,129. By the end of 2011, the U.S. exported $678,761,807,970 of products and imported $760,260,777,484 for a total net trade deficit of $81,498,969,5145, the third lowest since 2000; 2009 and 2010 were lower at $62 billion and $79 billion respectively.
The relatively low trade deficit of 2011 may be indicative of increased manufacturing in the United States; however this is not the case. As will be discussed, most of what we exported was trans-shipped from other FTA partner countries; almost $100 billion more than in 2010. Taking historical data as indicators, it is not inconceivable that 2012 will be the first year that will end with $1 trillion worth of imports and $900 billion of exports. Imports and exports in 2013 will be the first year to exceed $1 trillion each because Congress won’t make ex-patriot U.S. corporations pay import tariffs and taxes on foreign income.
| 2011 |
Imports in Dollars |
Exports in Dollars |
FTA Trade Balance |
| Australia |
10,239,941,165 |
27,515,747,704 |
17,275,806,539 |
| Bahrain |
518,434,741 |
1,213,175,421 |
694,740,680 |
| Canada |
316,510,221,442 |
280,891,114,516 |
35,619,106,926 |
| Chile |
9,068,787,467 |
15,873,394,302 |
6,804,606,835 |
| Colombia |
23,115,942,741 |
14,314,594,567 |
8,801,348,174 |
| Costa Rica |
10,118,401,890 |
6,118,067,713 |
4,000,334,177 |
| Dominican Republic |
4,190,441,376 |
7,346,195,144 |
3,155,753,768 |
| El Salvador |
2,482,711,077 |
3,371,478,013 |
888,766,936 |
| Guatemala |
4,142,625,958 |
6,205,289,059 |
2,062,663,101 |
| Honduras |
4,500,074,732 |
6,139,350,280 |
1,639,275,548 |
| Israel |
23,027,430,144 |
13,955,868,604 |
9,071,561,540 |
| Jordan |
1,060,516,070 |
1,454,325,707 |
393,809,637 |
| Mexico |
263,105,802,935 |
197,543,674,806 |
65,562,128,129 |
| Morocco |
994,973,354 |
2,862,627,027 |
1,867,653,673 |
| Nicaragua |
2,604,311,134 |
1,053,179,446 |
1,551,131,688 |
| Oman |
2,208,976,365 |
1,433,985,527 |
774,990,838 |
| Panama |
389,199,352 |
8,252,590,481 |
7,863,391,129 |
| Peru |
6,235,793,192 |
8,319,165,513 |
2,083,372,321 |
| Singapore |
19,110,659,249 |
31,392,979,341 |
12,282,320,092 |
| South Korea |
56,635,533,100 |
43,505,004,799 |
13,130,528,301 |
| FTA Trade Balances |
760,260,777,484 |
678,761,807,970 |
81,498,969,514 |
Click image for a larger view.
These are the top 20 combined FTA imports for 2011, most of these are American products made elsewhere. Some of which are from companies in non-FTA countries importing through our FTA partners.
| Product Group |
FTA Imports |
Global Imports |
Percent of Global Imports |
| Crude Oil - All grades |
125,114,424,632 |
331,698,122,555 |
37.72% |
| Passenger cars, new and used |
62,146,712,794 |
122,223,175,134 |
50.85% |
| Other parts and accessories |
43,142,205,742 |
76,804,471,786 |
56.17% |
| Complete and assembled |
18,083,256,430 |
19,438,112,295 |
93.03% |
| Other (clocks, port typewriters, other household goods |
16,848,119,313 |
77,678,889,383 |
21.69% |
| Other petroleum products |
16,328,083,128 |
50,879,503,204 |
32.09% |
| U.S. goods returned, and re-imports |
16,325,594,455 |
41,308,801,873 |
39.52% |
| Television receivers, vcr's & other video equip. |
15,866,177,140 |
33,486,023,935 |
47.38% |
| Medicinal, dental and pharmaceutical preparations |
14,735,281,083 |
91,509,451,959 |
16.10% |
| Computers |
14,645,073,332 |
64,904,016,437 |
22.56% |
| Telecommunications equipment |
13,971,045,788 |
48,457,425,472 |
28.83% |
| Electric apparatus and parts, n.e.c. |
13,802,623,354 |
41,538,400,164 |
33.23% |
| Nonmonetary gold |
13,780,797,834 |
15,585,680,617 |
88.42% |
| Semiconductors and related devices |
13,653,399,129 |
37,938,292,508 |
35.99% |
| Gas-natural |
12,962,732,594 |
14,850,591,743 |
87.29% |
| Engines and engine parts |
12,239,443,818 |
24,402,398,574 |
50.16% |
| Fuel oil |
11,054,150,870 |
46,945,096,451 |
23.55% |
| Other industrial machinery |
10,879,838,119 |
44,945,256,556 |
24.21% |
| Other (boxes, belting, glass, abrasives, etc.) |
10,331,019,050 |
26,546,720,174 |
38.92% |
| Other scientific, medical and hospital equipment |
9,765,547,908 |
30,412,744,239 |
32.11% |
Manufacturing is not dead in America; it is however on a decline. Most of the manufacturers that have remained in the United States are not able to export their products due to laws designed to keep them out of the global market. Most tax and export laws create a financial barrier that prevents or stops the exportation of “Made in USA” products from small manufacturers. Many small manufacturers are forced to obtain American branded supplies, equipment and materials that are imported as these are not available as “Made in USA” thereby preventing them from supporting American jobs and other stay-at home manufacturers.
A significant amount of the finished products that we export are, and thankfully, from large foreign based companies that are manufacturing in the U.S. Although significant numbers of these foreign corporations are in the financial and or retail industries, there are other manufacturers not listed that do not contribute to political campaigns and therefore use only employment opportunities as influence.
Most products “Made in USA” by foreign corporations remain in the United States for consumer and industrial use; many of these are high dollar value products such as automotive and industrial machinery. There are some food and beverage products within the consumer intended inventories, the economic impact is somewhat reduced as the packaging was imported by ex-patriot American manufacturers.
The automotive industry started to get a huge boost when Japanese auto makers started to produce cars and light trucks in the U.S., the down side though is that many of the major components such as engines and transmissions were imported. Germany and South Korea both have limit auto manufacturing in the U.S. Industrial machinery and equipment manufactured in the U.S. by foreign corporations contribute to the overall economy although the average consumer is not likely to purchase these.
These are the top 20 exports sent to our FTA partners in 2011. As these products may indicate that manufacturing in the U.S. is strong, these numbers are deceptive. Comparing this list to the top 20 imports from our FTA partners, it’s not hard to see how many of these are transshipped to other FTA and non-FTA partner countries. It’s also easy to see the unfinished and partially finished products sent to our FTA partners to be re-imported as finished American products. Transshipping is part of our GDP as there are employment and income opportunities derived from this activity.
| Product Group |
FTA Exports |
Global Exports |
Percent of Global Exports |
| Other parts and accessories of vehicles |
39,045,176,312 |
47,365,339,805 |
82.43% |
| Petroleum products, other |
35,837,943,882 |
54,237,010,317 |
66.08% |
| Fuel oil |
25,020,968,937 |
52,800,539,232 |
47.39% |
| Electric apparatus |
21,267,718,818 |
35,118,902,366 |
60.56% |
| Industrial machines, other |
21,244,770,772 |
45,246,225,629 |
46.95% |
| Passenger cars, new and used |
19,154,245,716 |
47,354,593,365 |
40.45% |
| Computer accessories |
19,083,816,646 |
31,567,258,172 |
60.45% |
| Plastic materials |
18,408,120,336 |
36,025,994,150 |
51.10% |
| Civilian aircraft, engines, equipment, and parts |
16,635,208,075 |
80,172,454,470 |
20.75% |
| Semiconductors |
16,346,164,818 |
43,773,152,276 |
37.34% |
| Telecommunications equipment |
15,849,431,940 |
35,849,294,688 |
44.21% |
| Trucks, buses and special purpose vehicles |
15,785,832,823 |
19,412,257,448 |
81.32% |
| Minimum value shipments |
14,084,425,703 |
30,028,425,150 |
46.90% |
| Chemicals-organic |
14,010,110,215 |
39,419,030,345 |
35.54% |
| Other industrial supplies |
13,970,907,794 |
22,985,042,545 |
60.78% |
| Industrial engines |
11,938,874,755 |
28,102,493,451 |
42.48% |
| Finished metal shapes |
11,911,703,271 |
17,894,329,339 |
|
| Chemicals-other |
11,597,984,068 |
28,783,602,478 |
40.29% |
| Engines and engine parts |
10,789,618,683 |
14,495,781,828 |
74.43% |
| Excavating machinery |
10,583,639,977 |
16,656,046,446 |
63.54% |
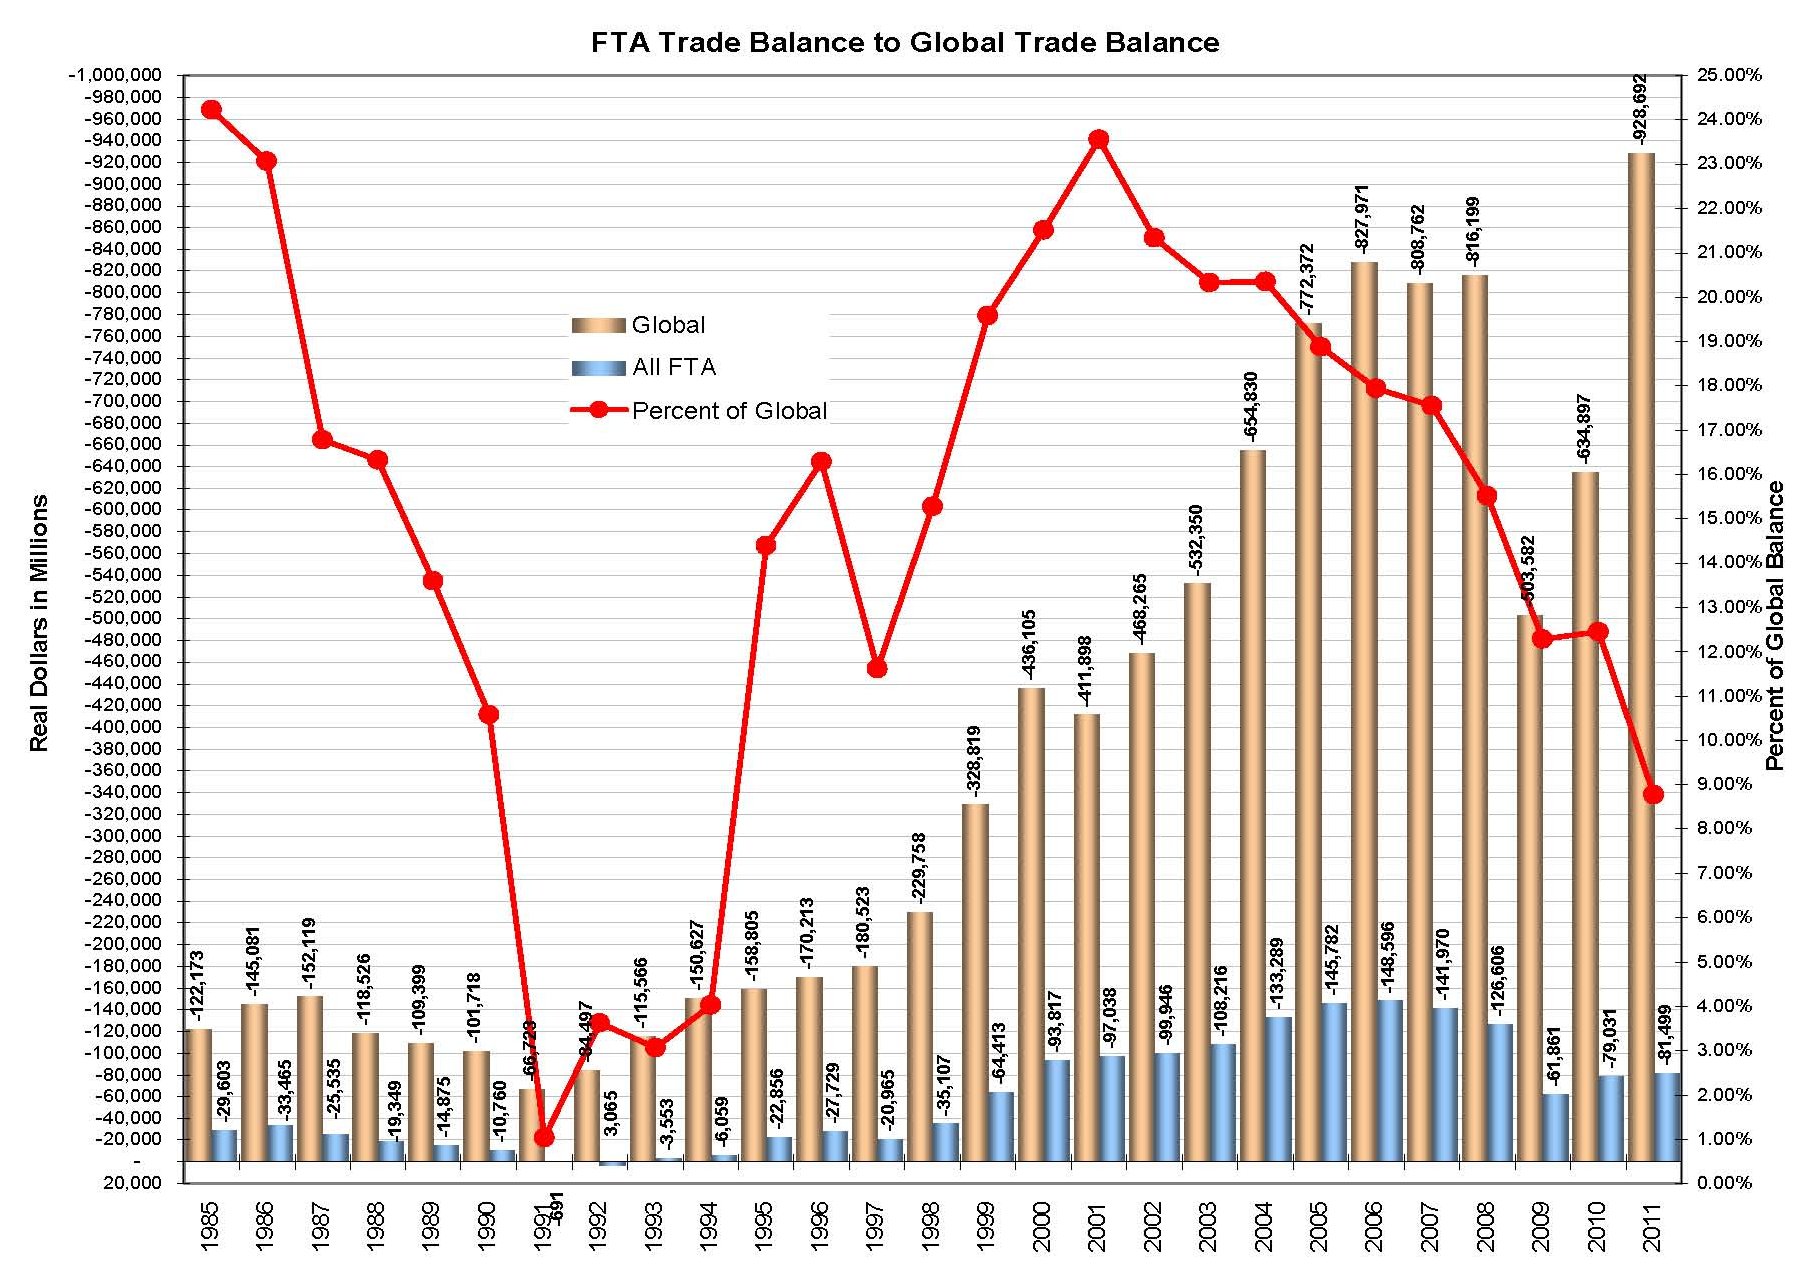
In 1985 our net global trade deficit at the end of the year was $122,173,000,000; our net trade deficit for our future FTA partners was $29,603,200,000, 24.23% of our global trade. For the next 10 years, through 1994, our FTA trade deficit rate remained under 25% of our global net trade deficit. The best year we had with our FTA partners was 1992, with a trade surplus of $3,064,900,000, 3.63% of our global trade. Between 1985 and 1994, we had two active FTA partners, Israel and Canada, although we were trading with our future partners. In 1994, we had a trade deficit of $6,059,000,000, almost $2.5 billion over 1993. Two years after NAFTA was ratified, 1995, our FTA net trade deficit hit $22,856,100,000. Of the years covered only 1992 was the only one in which we had a trade surplus of $3,064,900,000.
| Year |
All FTA Imports |
All FTA Exports |
All FTA Balance |
| 1985 |
113,690,100,000 |
84,086,900,000 |
-29,603,200,000 |
| 1986 |
115,139,400,000 |
81,674,800,000 |
-33,464,600,000 |
| 1987 |
127,688,400,000 |
102,153,900,000 |
-25,534,500,000 |
| 1988 |
146,953,200,000 |
127,604,500,000 |
-19,348,700,000 |
| 1989 |
158,321,900,000 |
143,446,600,000 |
-14,875,300,000 |
| 1990 |
167,459,300,000 |
156,699,600,000 |
-10,759,700,000 |
| 1991 |
166,730,600,000 |
166,039,400,000 |
-691,200,000 |
| 1992 |
181,098,900,000 |
184,163,800,000 |
3,064,900,000 |
| 1993 |
201,810,700,000 |
198,257,800,000 |
-3,552,900,000 |
| 1994 |
236,193,800,000 |
230,134,800,000 |
-6,059,000,000 |
| 1995 |
275,268,300,000 |
252,412,200,000 |
-22,856,100,000 |
| 1996 |
302,935,100,000 |
275,205,700,000 |
-27,729,400,000 |
| 1997 |
330,945,700,000 |
309,980,900,000 |
-20,964,800,000 |
| 1998 |
348,030,900,000 |
312,924,300,000 |
-35,106,600,000 |
| 1999 |
400,646,000,000 |
336,233,300,000 |
-64,412,700,000 |
| 2000 |
475,442,100,000 |
381,625,500,000 |
-93,816,600,000 |
| 2001 |
444,341,100,000 |
347,302,700,000 |
-97,038,400,000 |
| 2002 |
442,233,100,000 |
342,286,700,000 |
-99,946,400,000 |
| 2003 |
463,004,743,004 |
354,788,949,113 |
-108,215,793,891 |
| 2004 |
532,031,261,881 |
398,742,433,798 |
-133,288,828,083 |
| 2005 |
585,291,454,062 |
439,509,889,250 |
-145,781,564,812 |
| 2006 |
638,786,985,284 |
490,190,827,547 |
-148,596,157,737 |
| 2007 |
669,552,042,615 |
527,581,780,116 |
-141,970,262,499 |
| 2008 |
702,550,760,022 |
575,945,188,089 |
-126,605,571,933 |
| 2009 |
527,982,295,168 |
466,121,472,992 |
-61,860,822,176 |
| 2010 |
658,089,212,800 |
579,058,495,482 |
-79,030,717,318 |
| 2011 |
760,260,777,484 |
678,761,807,970 |
-81,498,969,514 |
Click image for a larger view.
Import/export data for Global Trade can be obtained from:
Census Bureau - Foreign Trade.
U.S. Trade Representative - Free Trade Agreements
Department of Labor - Employment and Training Administration - Trade Adjustment Assistance for Workers
U.S. Trade Representative - President Obama Signs Trade Agreements and Trade Adjustment Assistance Into Law
opensecrets.org - Foreign-connected PACs