Global trade has been a vital part of this country since the 1600’s. We imported what we needed through the mid 1700’s. Most of what we exported through the mid 1800’s was lumber, coal, whale, some agriculture and live stock. By 1870 we were exporting gold, silver, copper, iron and some manufactured products. By the time Henry Ford had revolutionized mass production, we were exporting steel, oil, rubber, cars and aircraft; all of it made right here in the United States. At the end of World War II, we built and produced almost everything we needed and wanted. We were making radios, cars, synthetics, medicine and medical devices. We were exporting agricultural products grown and harvested on square miles of land, not just acres. If another country wanted it, we had it. By 1960, we were the richest country in the world. We lost our economic stature in 1976. OPEC cut us off from the one commodity we didn’t produce enough of; oil.
If we fail to recognize the importance of international trading, we short-change ourselves and our economy. It is absolutely important that we continue our global presence. We must do it in a way that benefits the United States as a whole, not individual persons or companies. The failures of our Congresses since the mid ‘70’s have created an irreversible global trade deficit. Our trade with other countries is arranged to benefit individual companies or industries, not the nation. The U.S. needs fair and equal trade.
The last year the United States had a global net trade surplus was 1975 with $12,404 billion ($52,259 billion in 2012 dollars). At the end of 2011 the U.S. traded with 235 countries, including our FTA partners, we have an accumulated gross trade deficit totaling $928 billion with 95 of those countries. Our exports for 2011 totaled $1.48 trillion; an increase of $200 billion from 2010. Up front this is impressive, that looks even more impressive when we look at the products exported. When examining who we exported to and what we exported and what was imported, the United States is nothing more than a wholesale distributor for other countries. Our top three export recipients, Canada, Mexico and China account for almost 40% of our trans-shipment exports. These are the same three countries we import most of our products from as well. Most of what we exported to Canada originally came from China and Mexico, mostly China, most of which were branded by U.S. based ex-patriot corporations such as Apple, Microsoft, Black & Decker, Levis, IBM; the list continues. American brands aren’t the only products we exported, but account for most of our exports.
Some of the products that were exported were made in the U.S. weren’t American brands. Toyota, one of the largest car and light truck manufacturers in the United States exported “Made in USA” vehicles for the Canadian market. Other manufacturers would have been Siemens of Germany, Kia of South Korea and Westinghouse Electric of Japan.
Even after the Fukushima, Japan earthquake and subsequent tsunami in March of
2011, we finished with a $46 billion trade deficit with Japan, mostly cars and auto parts for both American and Japanese vehicles, industrial machinery and computer parts and peripherals. Japan’s economic recovery from a natural disaster is far better than an economic recovery because of a man-made financial disaster.
These are the top 20 countries we exported to in 2011.
Countries in red are those with which we have trade deficits.
| Country |
Exports in Dollars |
Percent of
Global Exports |
| Canada |
280,891,114,516 |
18.97% |
| Mexico |
197,543,674,806 |
13.34% |
| China |
103,878,554,773 |
7.02% |
| Japan |
66,168,328,820 |
4.47% |
| United Kingdom |
55,963,534,142 |
3.78% |
| Germany |
49,134,174,634 |
3.32% |
| South Korea |
43,505,004,799 |
2.94% |
| Brazil |
42,943,393,779 |
2.90% |
| Netherlands |
42,826,973,461 |
2.89% |
| Hong Kong |
36,512,581,188 |
2.47% |
| Singapore |
31,392,979,341 |
2.12% |
| Belgium |
29,876,948,901 |
2.02% |
| France |
27,844,315,935 |
1.88% |
| Australia |
27,515,747,704 |
1.86% |
| Taiwan |
25,898,410,803 |
1.75% |
| Switzerland |
24,452,738,010 |
1.65% |
| India |
21,627,596,974 |
1.46% |
| Italy |
15,991,314,100 |
1.08% |
| United Arab Emirates |
15,893,845,362 |
1.07% |
| Chile |
15,873,394,302 |
1.07% |
The United States has an unofficial standing policy of trans-shipment; exporting products that were imported. Of the top 20 exports for 2011, most of the finished products were imported for trans-shipment. The raw and partially finished products were exported to be finished and re-imported as American brand products. Had it not been for Boeing and McDonnell-Douglas, completed aircraft leaving the
U.S. for commercial use by foreign owned airlines, aircraft and parts wouldn’t be our number one export; petroleum products for plastics, fertilizers, insecticides and lubricants would have taken the top spot followed fuel oil for transportation – this excludes gasoline.
The petroleum products exported were refined from the $331 billion of imported oil.
The plastics, chemicals and other petroleum compounds were exported to China and
South America to make American brand toys, household goods, casings for small and medium power tools and some of the car parts for trans-shipment.
The semiconductors went to China and came back as computers, telecom products and other electronics, some were American brands and others were Japanese and Korean brands.
We exported just over $47 billion worth of car parts, mostly to Canada and Mexico, no less than half of which was part of the $77.6 billion imported from Asia. Those new parts were returned as new cars from Canada and Mexico. One third of the cars exported came from the $122 billion that were imported mostly from Canada and Mexico. Two thirds of the cars exported were “Made in USA”, half of which were
Japanese, Korean and German brands that were at least partially “Made in USA”.
| Country |
Exports in Dollars |
Percent of
Global Exports |
| Civilian aircraft, engines, equipment, and parts |
80,172,454,470 |
5.41% |
| Petroleum products, other |
54,237,010,317 |
3.66% |
| Fuel oil |
52,800,539,232 |
3.57% |
| Other parts and accessories of vehicles |
47,365,339,805 |
3.20% |
| Passenger cars, new and used |
47,354,593,365 |
3.20% |
| Pharmaceutical preparations |
45,468,815,842 |
3.07% |
| Industrial machines, other |
45,246,225,629 |
3.06% |
| Semiconductors |
43,773,152,276 |
2.96% |
| Chemicals-organic |
39,419,030,345 |
2.66% |
| Plastic materials |
36,025,994,150 |
2.43% |
| Telecommunications equipment |
35,849,294,688 |
2.42% |
| Electric apparatus |
35,118,902,366 |
2.37% |
| Nonmonetary gold |
33,228,280,326 |
2.24% |
| Medicinal equipment |
32,041,186,500 |
2.16% |
| Computer accessories |
31,567,258,172 |
2.13% |
| Minimum value shipments |
30,028,425,150 |
2.03% |
| Chemicals-other |
28,783,602,478 |
1.94% |
| Industrial engines |
28,102,493,451 |
1.90% |
| Measuring, testing, control instruments |
23,742,788,374 |
1.60% |
| Other industrial supplies |
22,985,042,545 |
1.55% |
Our imports are extensive. With the exception of food, a majority of what Americans use is imported including some electronic supplies for our Armed Forces. Our imports for 2011 were $2.2 trillion, leaving us with a total net trade deficit of $726.3 billion.
China, Canada and Mexico provided 45% of our global imports of consumer products, a significant amount of which was exported to Europe and the Middle East and North Africa. Most of the American branded products that we buy were made in the top three countries.
American branded products would have made up over three-fourths of our trade deficit. Almost half of our trade deficit was from crude oil of all grades; $332 billion. Half of the remaining $394 billion of the deficit was American branded consumer products or roughly $195 billion; as much as or more than two million Americans could be directly employed manufacturing U.S. products. Indirect and peripheral employment in supportive manufacturing and services could be an additional two million Americans working.
The second largest group of victims of imported products after the men and women who once worked in well paying manufacturing jobs are home owners, especially those looking to buy new construction. Under Federal Trade Commission regulations, most homes built in the northern U.S. after 1994 cannot be considered “Made in USA”, these homes are only considered as “Assembled in USA”. Almost everything to build a brand new house was imported by U.S. manufacturers from Canada and China. Everything from lumber for framing to the vinyl for windows and siding is imported.
These are the top 20 countries where most of the $1.9 trillion of imports in 2011 came from. Most of the imported American branded products were from China, Canada and Mexico. Most of our trade deficits with Japan and Germany would have come primarily from cars and light trucks as well as new and replacement parts for those vehicles including the brands “Made in USA”.
Countries in red are those with which we have trade deficits.
| Country |
Imports in Dollars |
Percent of
Global Imports |
| China |
399,335,065,066 |
18.09% |
| Canada |
316,510,221,442 |
14.34% |
| Mexico |
263,105,802,935 |
11.92% |
| Japan |
128,811,280,219 |
5.84% |
| Germany |
98,400,502,465 |
4.46% |
| South Korea |
56,635,533,100 |
2.57% |
| United Kingdom |
51,176,362,978 |
2.32% |
| Saudi Arabia |
47,476,329,712 |
2.15% |
| Venezuela |
43,253,442,817 |
1.96% |
| Taiwan |
41,327,767,961 |
1.87% |
| France |
39,983,421,736 |
1.81% |
| Ireland |
39,220,258,737 |
1.78% |
| India |
36,167,368,828 |
1.64% |
| Russia |
34,572,550,820 |
1.57% |
| Italy |
33,968,404,802 |
1.54% |
| Nigeria |
33,738,304,286 |
1.53% |
| Brazil |
31,371,885,748 |
1.42% |
| Malaysia |
25,771,824,155 |
1.17% |
| Thailand |
24,826,069,858 |
1.12% |
| Switzerland |
24,414,186,577 |
1.11% |
By comparing our 2011 imports with what we exported, it’s very clear what finished products were not “Made in USA”. Almost all of the raw materials and partially finished products were imported as the finished American brand products we buy. Of the top 20 products imported, most are American products that aren’t “Made in USA” anymore such as the toys, computers, telecom, home entertainment and miscellaneous household goods.
As previously stated, oil accounted for almost half of our global trade deficit. Among the completed American products imported, cars and light trucks took almost one fifth of our trade deficit followed by medical devices. Neither Canada nor Mexico has their own automotive brands, this would put most imported vehicles as American; GM, Dodge-Chrysler and Ford.
Ireland, Germany, Switzerland and the United Kingdom combined produced 56% of our imported medical and dental devices and other products. The cost of labor in
Europe is greater than in the United States; U.S. brands are produced in Europe, but are tax-free upon port entry. Most if not all European based manufacturers have sales and wholesale facilities in the U.S. but are subject to some import tariffs. Europe, like the United States has high standards in regards to quality, as a result very little of these products are manufactured by contracted facilities outside of Europe and the United States.
Without exception, every American household has a product or roomful of other products from decorative wall clocks to waffle irons, 52% came from China; most of that 52% are U.S. brands. Something used almost every day in most American households; the coffee maker. Only one manufacturer has “Assembled in USA”; Bunn.
We haven’t made computers in the U.S. for over a decade; the big brands such as
HP, IBM and Dell have sent that part of their business to China. Even “customs” aren’t made in the U.S., they are assembled and repaired here with parts and peripherals made in China and some parts from Japan and Taiwan. The U.S. imported $65 billion worth of computers and exported $66 million worth, none of which were “Made in USA”, 100% of the computers exported were trans-shipped.
As we further explore “green” energies, this list will change and the individual components for these will also be American brands imported after the raw materials will be exported. Most of the electronics that will be needed to make “green” energy viable exists, but not manufactured in the U.S. The steel, aluminum and other alloys are mostly milled and or processed offshore. Green technology won’t be the employment sector of the future for the American blue collar worker.
After oil, most of the remaining 19 top imports for 2011 were manufactured by U.S. based ex-patriot corporations with little or no actual facilities or American workers beyond sales and administrative support in the United States.
| Product |
Imports in Dollars |
Percent of
Global Imports |
| Crude Oil, All Grades |
331,698,122,555 |
15.03% |
| Passenger cars, new and used |
122,223,175,134 |
5.54% |
| Medicinal, dental and pharmaceutical preparations |
91,509,451,959 |
4.15% |
| Other (clocks, port typewriters, oth household gds |
77,678,889,383 |
3.52% |
| Other parts and accessories vehicles |
76,804,471,786 |
3.48% |
| Computers |
64,904,016,437 |
2.94% |
| Computer accessories, peripherals and parts |
54,794,447,860 |
2.48% |
| Other petroleum products |
50,879,503,204 |
2.31% |
| Apparel and household goods-cotton |
50,381,999,510 |
2.28% |
| Telecommunications equipment |
48,457,425,472 |
2.20% |
| Fuel oil |
46,945,096,451 |
2.13% |
| Other industrial machinery |
44,945,256,556 |
2.04% |
| Electric apparatus and parts, n.e.c. |
41,538,400,164 |
1.88% |
| U.S. goods returned, and reimports |
41,308,801,873 |
1.87% |
| Semiconductors and related devices |
37,938,292,508 |
1.72% |
| Apparel and household goods-other textiles |
36,955,235,194 |
1.67% |
| Television receivers, vcr's & other video equip. |
33,486,023,935 |
1.52% |
| Toys, shooting and sporting goods, and bicycles |
32,957,158,062 |
1.49% |
| Other scientific, medical and hospital equipment |
30,412,744,239 |
1.38% |
| Other (boxes, belting, glass, abrasives, etc.) |
26,546,720,174 |
1.20% |
Starting in 1998 taxes on American corporations started changing to make it easier and less expensive to go offshore. The one tax that was removed was import tariffs.
The tax law changed in that as long as the product entered the United States with a brand originating in America then no import tariff would be assessed. Tariffs were
5% to 25% of the retail value of products depending on the country of origin, this equates to a loss of taxes from $ 11.5 billion to as much as $181 billion per year since 1998. Another tax breaks include 100% of the costs of relocating offshore, a portion of income that is not taxed; up to the first $100 million of gross income earned offshore. Taxes on businesses is 35%, however, once larger corporations, mostly those considered “multi-national” receive their tax breaks, they had an average effective tax rate of 12% at the end of 2011. The total cost of tax-breaks to American middle-class taxpayers and U.S. businesses that remain in the United States may be as much as $500 billion per year or more.
Our global trade deficit starts to increase as taxes are reduced on U.S. based corporations. As more Free Trade Agreements are made, it became easier for these corporations to become tax-free as import tariffs are removed and reciprocal countries removed the “presence” requirements from their laws. Most countries, including the United States, have a requirement that to become eligible for tax relief in their country, they must have a business presence. A business presence was considered as long as there was a fully staffed office. That has changed, now a presence needs only to be a written contract with a factory owner hired to manufacture products for an American company.
From 1994, the year NAFTA started to 1997 the deficit increased at an average of roughly $10 billion dollars each year. The lost manufacturing jobs once done by skilled middle-class Americans were replaced with low-paying jobs formerly held by high-school students. President Clinton with the help of a Democratic controlled House and Senate signed NAFTA despite the overwhelming evidence from several independent studies that indicated the Free Trade Agreements would be an economic failure for the United States.
From 1998 to 2000 the deficit increased almost $100 billion each year. The slight drop year over year from 2000 to 2001 was due to the volatile Presidential election between Bush and Gore. Bush was favored by the oil and natural Gasoline industries as someone who would protect their foreign interests. Gore was seen a foe to business and therefore a foe of the people because of his environmental stance.
Neither was seen as particularly strong economic or social leaders for America. Bush won by five electoral votes, although Gore had more of the popular vote, outdoing Bush by just over 500,000. The United States Supreme Court stepped in and required that Florida submit its vote count and ended the electoral debacle in Bush’s favor. The Bush administration, with the help of a Democratic controlled Congress, proved to be an economic disaster for the country.
Free Trade Agreements spread across Central and South America, so did American manufacturing jobs, at the same time the oil and Gasoline industry was allowed to slow domestic production with more subsidies and tax-free income from imported production. The deficit increases from 2001 to 2008 averaged almost $120 billion per year, over half of each annual increase was from oil and natural gas imports.
The deficit had nearly doubled from 1998 to 2000; by 2006 the deficit had hit $828 billion, the highest in history. The recession that started in 2007 had little effect on the deficit. Not until 2009 when major manufacturers let over 4 million Americans become unemployed did the deficit for a single year drop to $504 billion, the lowest since 2003. From 2008 to 2009 the trade deficit went from just over $816 billion to almost $504 billion, a $300 billion drop. With the auto and banking bailouts from 2008 to 2010 the deficit regained over $130 billion as those bailouts were used for offshore production of American products, no other years saw that large of an increase. As the 2012 Presidential election becomes more contentious, more major U.S. manufacturing is moving offshore as a result of the three FTA’s passed in 2011; Colombia, Panama and South Korea.
| Global Trade Balances |
| Year |
Imports |
Exports |
Balance |
| 1985 |
338,088,000,000 |
215,915,000,000 |
-122,173,000,000 |
| 1986 |
368,425,000,000 |
223,344,000,000 |
-145,081,000,000 |
| 1987 |
406,241,000,000 |
254,121,900,000 |
-152,119,100,000 |
| 1988 |
440,952,300,000 |
322,426,400,000 |
-118,525,900,000 |
| 1989 |
473,210,900,000 |
363,811,500,000 |
-109,399,400,000 |
| 1990 |
495,310,600,000 |
393,592,200,000 |
-101,718,400,000 |
| 1991 |
488,453,100,000 |
421,730,000,000 |
-66,723,100,000 |
| 1992 |
532,661,700,000 |
448,164,500,000 |
-84,497,200,000 |
| 1993 |
580,656,200,000 |
465,089,900,000 |
-115,566,300,000 |
| 1994 |
663,251,800,000 |
512,625,100,000 |
-150,626,700,000 |
| 1995 |
743,545,000,000 |
584,740,400,000 |
-158,804,600,000 |
| 1996 |
795,286,600,000 |
625,073,300,000 |
-170,213,300,000 |
| 1997 |
869,703,000,000 |
689,180,000,000 |
-180,523,000,000 |
| 1998 |
911,896,700,000 |
682,138,500,000 |
-229,758,200,000 |
| 1999 |
1,024,615,500,000 |
695,796,700,000 |
-328,818,800,000 |
| 2000 |
1,218,022,600,000 |
781,918,000,000 |
-436,104,600,000 |
| 2001 |
1,140,998,100,000 |
729,100,600,000 |
-411,897,500,000 |
| 2002 |
1,161,366,400,000 |
693,101,400,000 |
-468,265,000,000 |
| 2003 |
1,257,121,250,650 |
724,770,982,676 |
-532,350,267,974 |
| 2004 |
1,469,705,000,000 |
814,874,653,655 |
-654,830,346,345 |
| 2005 |
1,673,454,000,000 |
901,081,812,545 |
-772,372,187,455 |
| 2006 |
1,853,938,000,000 |
1,025,967,497,363 |
-827,970,502,637 |
| 2007 |
1,956,961,000,000 |
1,148,198,722,191 |
-808,762,277,809 |
| 2008 |
2,103,640,710,944 |
1,287,441,996,730 |
-816,198,714,214 |
| 2009 |
1,559,624,813,477 |
1,056,042,963,028 |
-503,581,850,449 |
| 2010 |
1,913,160,073,828 |
1,278,263,225,486 |
-634,896,848,342 |
| 2011 |
2,206,955,172,191 |
1,480,665,525,192 |
-726,289,646,999 |
| 2012 |
|
|
|
Click image for a larger view.
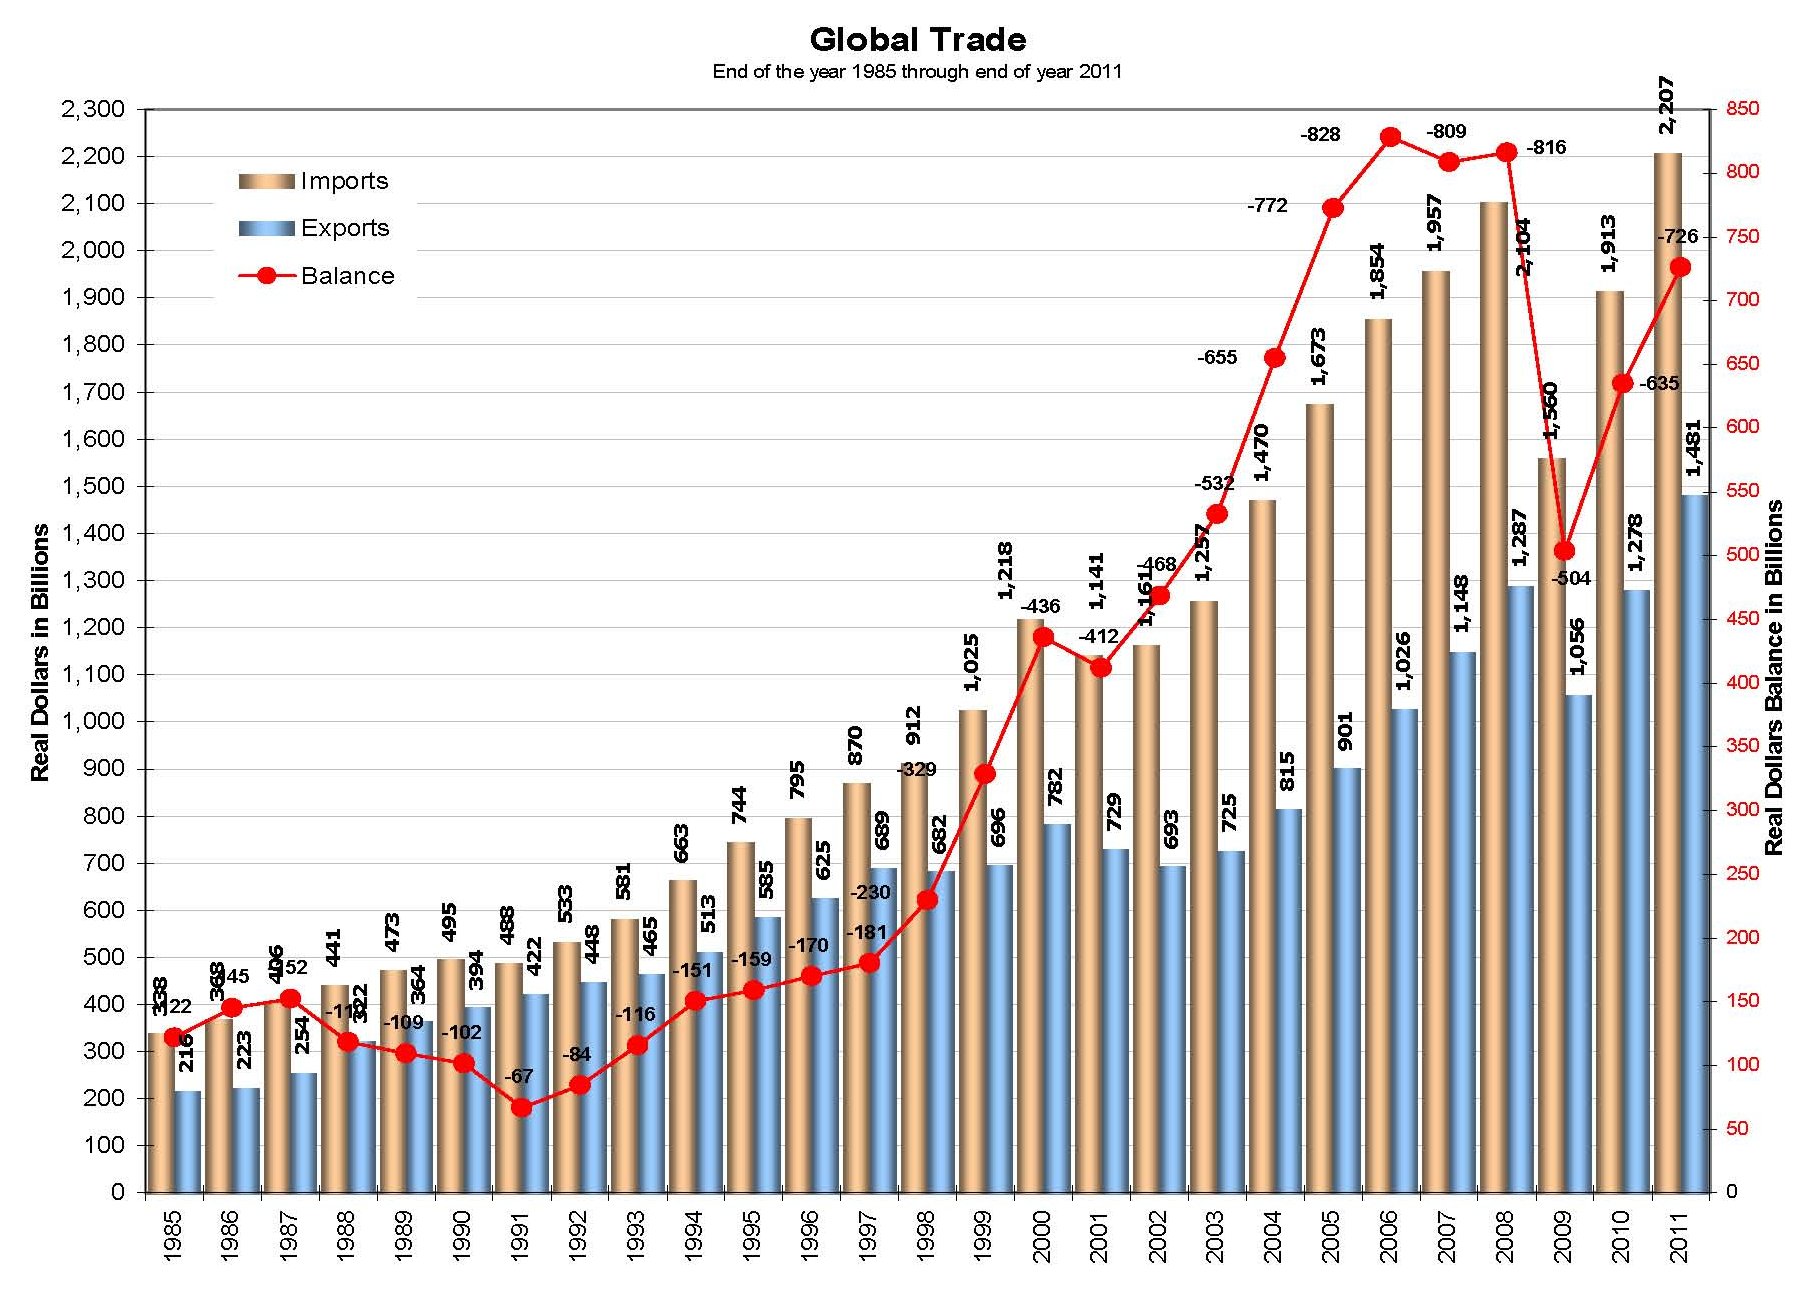
Import/export data for Global Trade can be obtained from Census Bureau - Foreign Trade.