Oil is included as part of this study because we import from seven FTA partners and therefore have an impact on that trade, global trade and related balances. This is not about whether we should be drilling, importing more or about using “green”, renewable sources and nuclear energy.
If we fail to recognize the importance of international trading, we short-change ourselves and our economy. It is absolutely important that we continue our global presence. We must do it in a way that benefits the United States as a whole, not individual persons or companies. The failures of our Congresses since the mid ‘70’s have created an irreversible global trade deficit. Our trade with other countries is arranged to benefit individual companies or industries, not the nation. The U.S. needs fair and equal trade.
We need oil. We mostly care about where it comes from. We always care about what it costs, especially when Americans are paying-at-the-pump for gasoline, diesel and home heating oil. Oil and its derivatives are so integral to American culture and business needs, that the decreased production of oil in the U.S. has had a very harmful effect. Oil imports are about 5% of our total net global trade deficit, and have been for over a decade. Oil has been our number one import since the late
1960s, not until 1976 did oil become a forefront issue from the public.
A majority of the United States House of Representatives in cooperation with TransCanada has attempted to increase our oil imports from Canada through an addition to the existing part of the Keystone XL pipeline. The existing line from Saskatchewan, Canada went into use in September 2010. According to proponents the new pipeline would create over 100,000 permanent jobs in the U.S. The Cornell Global Labor Institute finished a study in January 2012 stating that less than 1,000 permanent jobs will be created.
For the sixth year in a row we imported more oil from Canada than Saudi Arabia in 2011; the first year was 2006. Oil imported from Canada accounted for 14% to 18% of our total oil imports from 2002 through 2011. Of the nearly 662.7 billion barrels imported from Canada, almost 16 million barrels of it was exported from the United States, mostly from Alaska. President Obama opened 38 million acres of oil fields for leasing in the Gulf of Mexico in January 2012. The areas off of Louisiana, Mississippi and Alabama to be leased out could hold 1 billion barrels of oil and 4 trillion cubic feet of natural gas. The leases for the 38 million acres will go up for auction in June 2012. It will take up to ten years for full capacity of production to be reached on these leases. With a lead time of almost two years for most ocean rigs to start production the immediate affect will not start to be realized until 2014
For the sixth year in a row we imported more oil from Canada than Saudi Arabia in 2011; the first year was 2006. Oil imported from Canada accounted for 14% to 18% of our total oil imports from 2002 through 2011. Of the nearly 662.7 billion barrels imported from Canada, almost 16 million barrels of it was exported from the United States, mostly from Alaska. President Obama opened 38 million acres of oil fields for leasing in the Gulf of Mexico in January 2012. The areas off of Louisiana, Mississippi and Alabama to be leased out could hold 1 billion barrels of oil and 4 trillion cubic feet of natural gas. The leases for the 38 million acres will go up for auction in June 2012. It will take up to ten years for full capacity of production to be reached on these leases. With a lead time of almost two years for most ocean rigs to start production the immediate affect will not start to be realized until 2014.
Most of the oil we import and produce is used for plastics, fertilizers, paints & coatings, lubricants and road construction. Most of these products derived from oil were later exported to become finished and semi-finished products for import. A 1,500 square foot American home, fully furnished, may contain as much as 100 gallons of processed and refined oil; paints, stains, home entertainment, computers, refrigerators, freezers, small appliances, toys, storage containers and more all contain oil derivatives.
Heating and transportation uses less than 25% of processed or refined oil. Despite increased recycling, more stringent transportation use and bio-fuel supplements, refined oil use as gasoline, diesel and heating will increase with the exponential growth of need.
In 2011 we imported 3,806,614,000 barrels of crude oil of all grades at a total cost of $331,698,122,555 from these 48 countries, including seven of our *FTA partners and ‡OPEC. All of this oil entered the U.S. tariff free. Oil imported from our free trade partners are tariff free as required by the agreements. Oil imported from other countries entered as a product of American based oil companies.
| Country |
Imports in Dollars |
Barrels |
Country |
Imports in Dollars |
Barrels |
| *Canada |
67,971,149,424 |
662,692,218 |
Thailand |
657,181,646 |
6,407,265 |
| ‡Saudi Arabia |
45,727,405,178 |
445,824,380 |
Congo (Kinshasa) |
536,791,612 |
5,233,509 |
| *Mexico |
39,753,833,774 |
387,584,387 |
Vietnam |
433,037,176 |
4,221,944 |
| ‡Venezuela |
36,837,840,965 |
359,154,593 |
Kazakhstan |
419,332,189 |
4,088,325 |
| ‡Nigeria |
30,927,711,763 |
301,533,137 |
*Peru |
408,275,245 |
3,980,525 |
| ‡Iraq |
16,930,198,692 |
165,062,839 |
*Australia |
373,971,713 |
3,646,078 |
| *Colombia |
14,646,757,862 |
142,800,181 |
Ghana |
341,363,065 |
3,328,157 |
| ‡Angola |
12,928,920,173 |
126,051,933 |
Guatemala |
314,051,487 |
3,061,880 |
| Brazil |
9,271,625,097 |
90,394,731 |
‡United Arab Emirates |
241,728,024 |
2,356,754 |
| Russia |
8,003,748,630 |
78,033,430 |
Yemen |
241,177,131 |
2,351,383 |
| ‡Kuwait |
7,585,100,666 |
73,951,775 |
Bolivia |
216,946,976 |
2,115,148 |
| ‡Algeria |
7,307,540,927 |
71,245,676 |
‡Libya |
210,610,831 |
2,053,374 |
| ‡Ecuador |
7,297,269,589 |
71,145,535 |
Egypt |
169,904,525 |
1,656,503 |
| Gabon |
4,440,236,572 |
43,290,576 |
Cote d'Ivoire |
156,256,386 |
1,523,439 |
| Chad |
3,079,504,077 |
30,023,965 |
Belize |
124,543,644 |
1,214,252 |
| Azerbaijan |
2,416,122,562 |
23,556,253 |
Syria |
102,940,345 |
1,003,628 |
| Norway |
2,284,120,800 |
22,269,288 |
Malaysia |
62,887,780 |
613,131 |
| Congo (Brazzaville) |
2,070,838,092 |
20,189,864 |
China |
61,637,309 |
600,940 |
| United Kingdom |
1,739,572,831 |
16,960,157 |
‡Qatar |
36,833,820 |
359,115 |
| *Oman |
1,646,385,127 |
16,051,613 |
South Africa |
6,109,961 |
59,570 |
| Trinidad and Tobago |
1,235,892,661 |
12,049,472 |
Bahamas |
576,778 |
5,623 |
| Argentina |
1,072,360,240 |
10,455,094 |
Denmark |
465,000 |
4,534 |
| Indonesia |
723,072,753 |
7,049,678 |
Netherlands |
76,705 |
748 |
| Equatorial Guinea |
684,205,510 |
6,670,737 |
Germany |
9,242 |
90 |
We do produce our own oil; in 2011 we produced 2,059,970,182 barrels valued at $211,291,141,549. The last year we produced close to this amount of oil was 2003;
2,073,454,000 barrels valued at $57,491,313,951 (70,822,399,830 in 2012 dollars).
For the third year, 2009, 2010 and 2011, we started increasing U.S. production of oil for the first time in almost 40 years. Year over year we produced just over 114 million barrels in 2009 than in 2008, over 41.5 million more in 2010 over 2009 and almost 62 million more in 2011 more than in 2010. Before the November 2012 Presidential election it is possible that we will have produced almost 2.2 billion barrels without a significant increase of new wells.
We exported 15,198,000 barrels for $1,639,083,055 to Canada. Canada was the only country we exported oil to in 2008, 2009 and 20105, most of which was from Alaska on its way to the lower 48. The other countries we exported oil to in 2011 were Costa Rica 342,053, South Korea 1,054, Vietnam 315 and Mexico 68 for a total of 343,489 barrel’s; most of that came from the pre-existing Keystone pipeline from Canada to the Gulf of Mexico.
Supply and demand is the principal business concept that the greater the supply, the lower the price which creates the demand and that demand further creates the supply. Oil doesn’t follow that business concept. Oil prices follow national and global political winds. American and Middle-Eastern politics will cause the cost of crude to rise and fall as a result of the concerns of supply may or may not be disrupted. Domestic and global politics had a greater impact on the cost of oil than any year since 1976. American politics did more to impact oil prices than the political and social upheavals and changes in the Middle-East. Both Republicans and Democrats spent most of 2011 disparaging each other rather than separating fact from fiction in regards to energy.
Whenever the United States Congress gets into a budget battle, the first indication of failure to resolve the budget issues is the increase of crude oil prices. Tax subsidies to the oil industry are always one of the first things that are discussed. These subsidies are seen by the industry as a business necessity to stay competitive with and against itself. These subsidies are provided to both domestic and foreign oil companies as re-imbursement for the lease costs on federal lands and waterways. In an effort to offset the loss of these subsidies, commodity and futures brokers start to bet on the increase of the price of oil.
Political unrest in the Middle-east had an impact as well. Several Arab countries were entrenched in overthrowing dictators. We continue to import from these countries. Some of these countries have threatened to close or block international waters in an effort to control international efforts to stop human-rights violations. These and other threats have spurred speculation to the cost of crude oil. In almost all instances the actual cost of production has not increased crude oil prices.
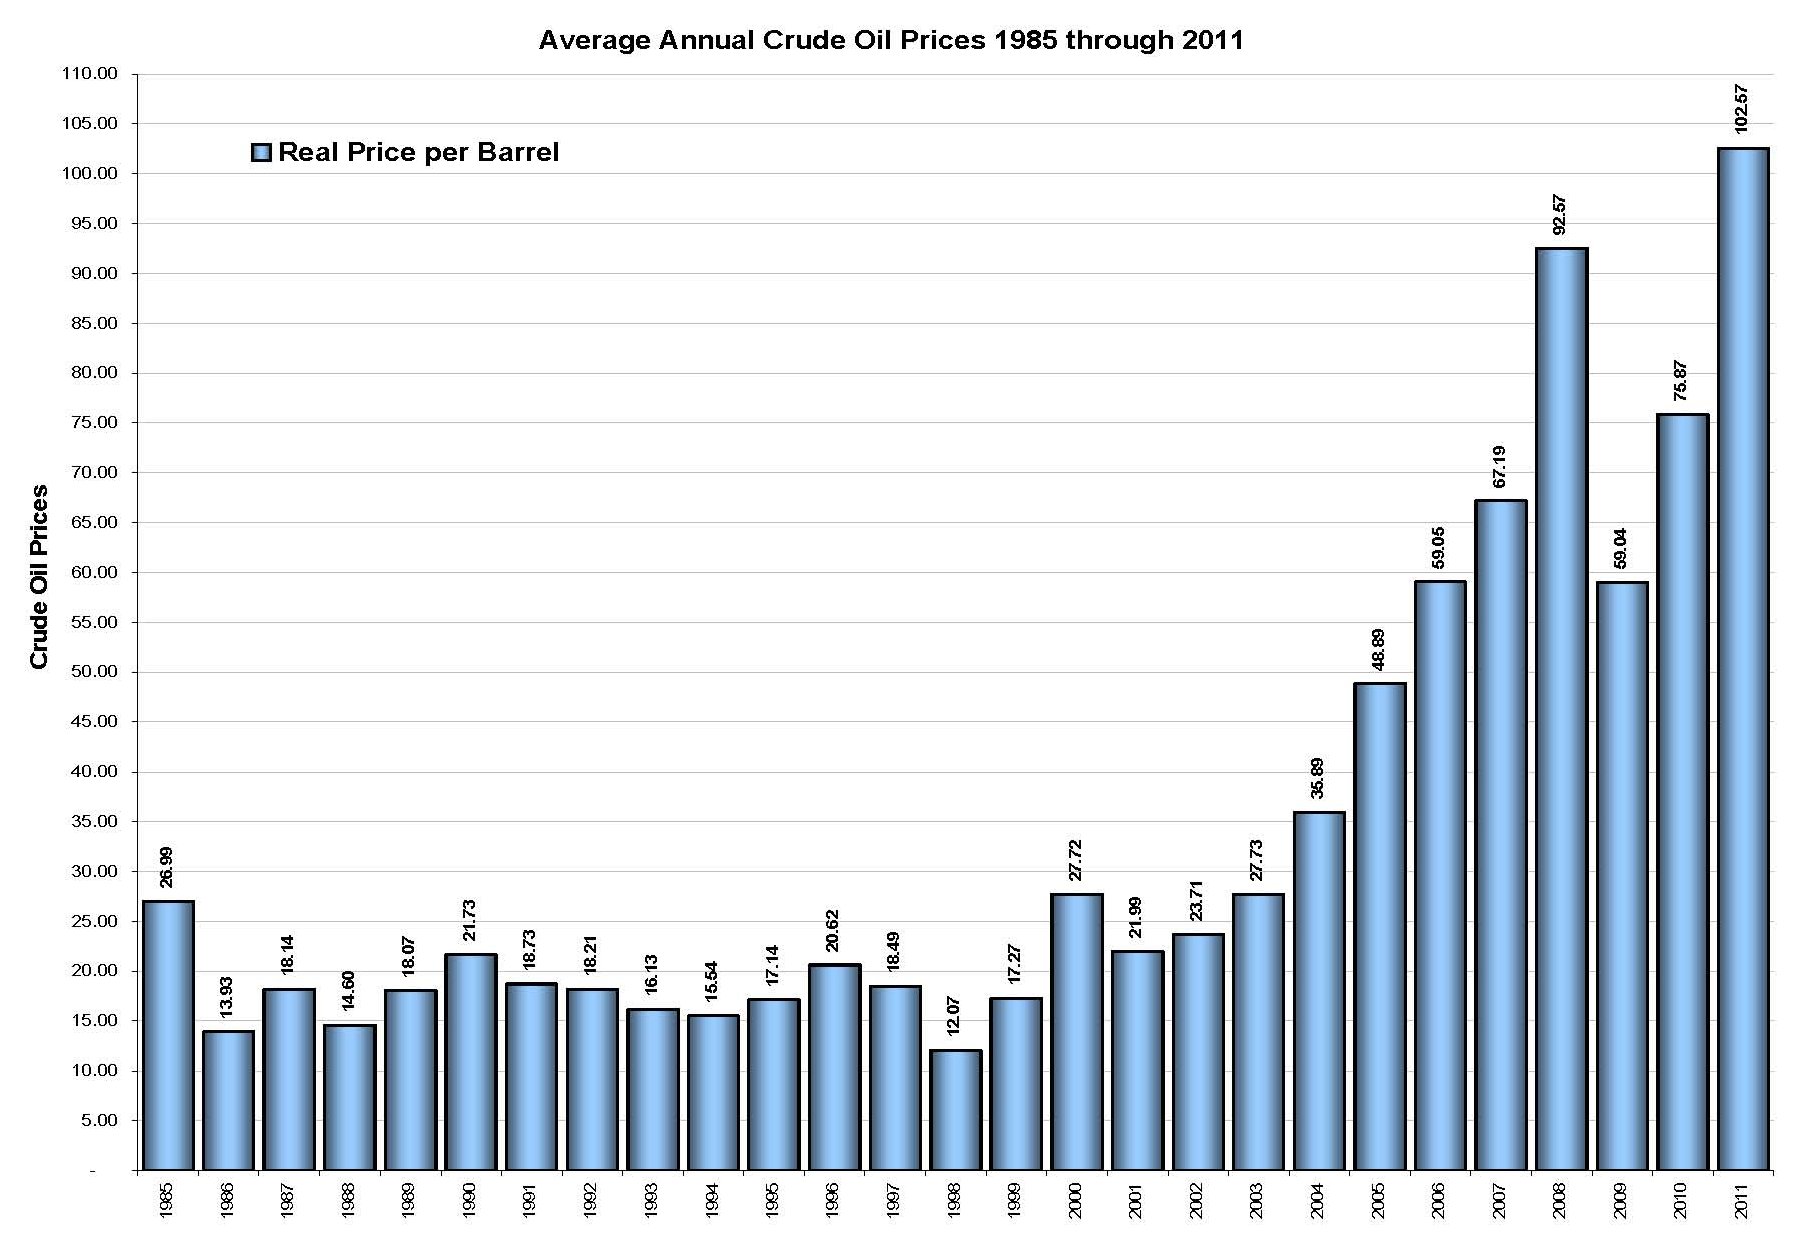
Opening at $85.59 per barrel in 2011 the year closed at about $105.50, peaking in May at $107.99; the average price for the year was $102.57. The year ending with the lowest average price of crude since 1985 was 1998. Significant differential jumps in oil prices occurred twice, the first and highest was 2008 with an increase of just over $30 year over year of 2007 and the second was 2011 at about $25 year over year of 20105. There was no consistency in the wild price fluctuations until 2003, at which time oil has consistently increased in price.
| Average Retail Price of Crude Oil for the Years 1985 through 2011 |
| Year |
Real Price per Barrel |
2012 Price per Barrel |
Year |
Real Price per Barrel |
2012 Price per Barrel |
Year |
Real Price per Barrel |
2012 Price per Barrel |
| 1985 |
26.99 |
56.86 |
1994 |
15.54 |
23.76 |
2003 |
27.73 |
34.16 |
| 1986 |
13.93 |
28.82 |
1995 |
17.14 |
25.50 |
2004 |
35.89 |
43.07 |
| 1987 |
18.14 |
36.19 |
1996 |
20.62 |
29.79 |
2005 |
48.89 |
56.74 |
| 1988 |
14.60 |
27.98 |
1997 |
18.49 |
26.11 |
2006 |
59.05 |
66.39 |
| 1989 |
18.07 |
33.03 |
1998 |
12.07 |
16.78 |
2007 |
67.19 |
73.45 |
| 1990 |
21.73 |
37.69 |
1999 |
17.27 |
23.50 |
2008 |
92.57 |
97.46 |
| 1991 |
18.73 |
31.16 |
2000 |
27.72 |
36.49 |
2009 |
59.04 |
62.37 |
| 1992 |
18.21 |
29.42 |
2001 |
21.99 |
28.15 |
2010 |
75.87 |
78.87 |
| 1993 |
16.13 |
25.31 |
2002 |
23.71 |
29.88 |
2011 |
102.57 |
103.35 |
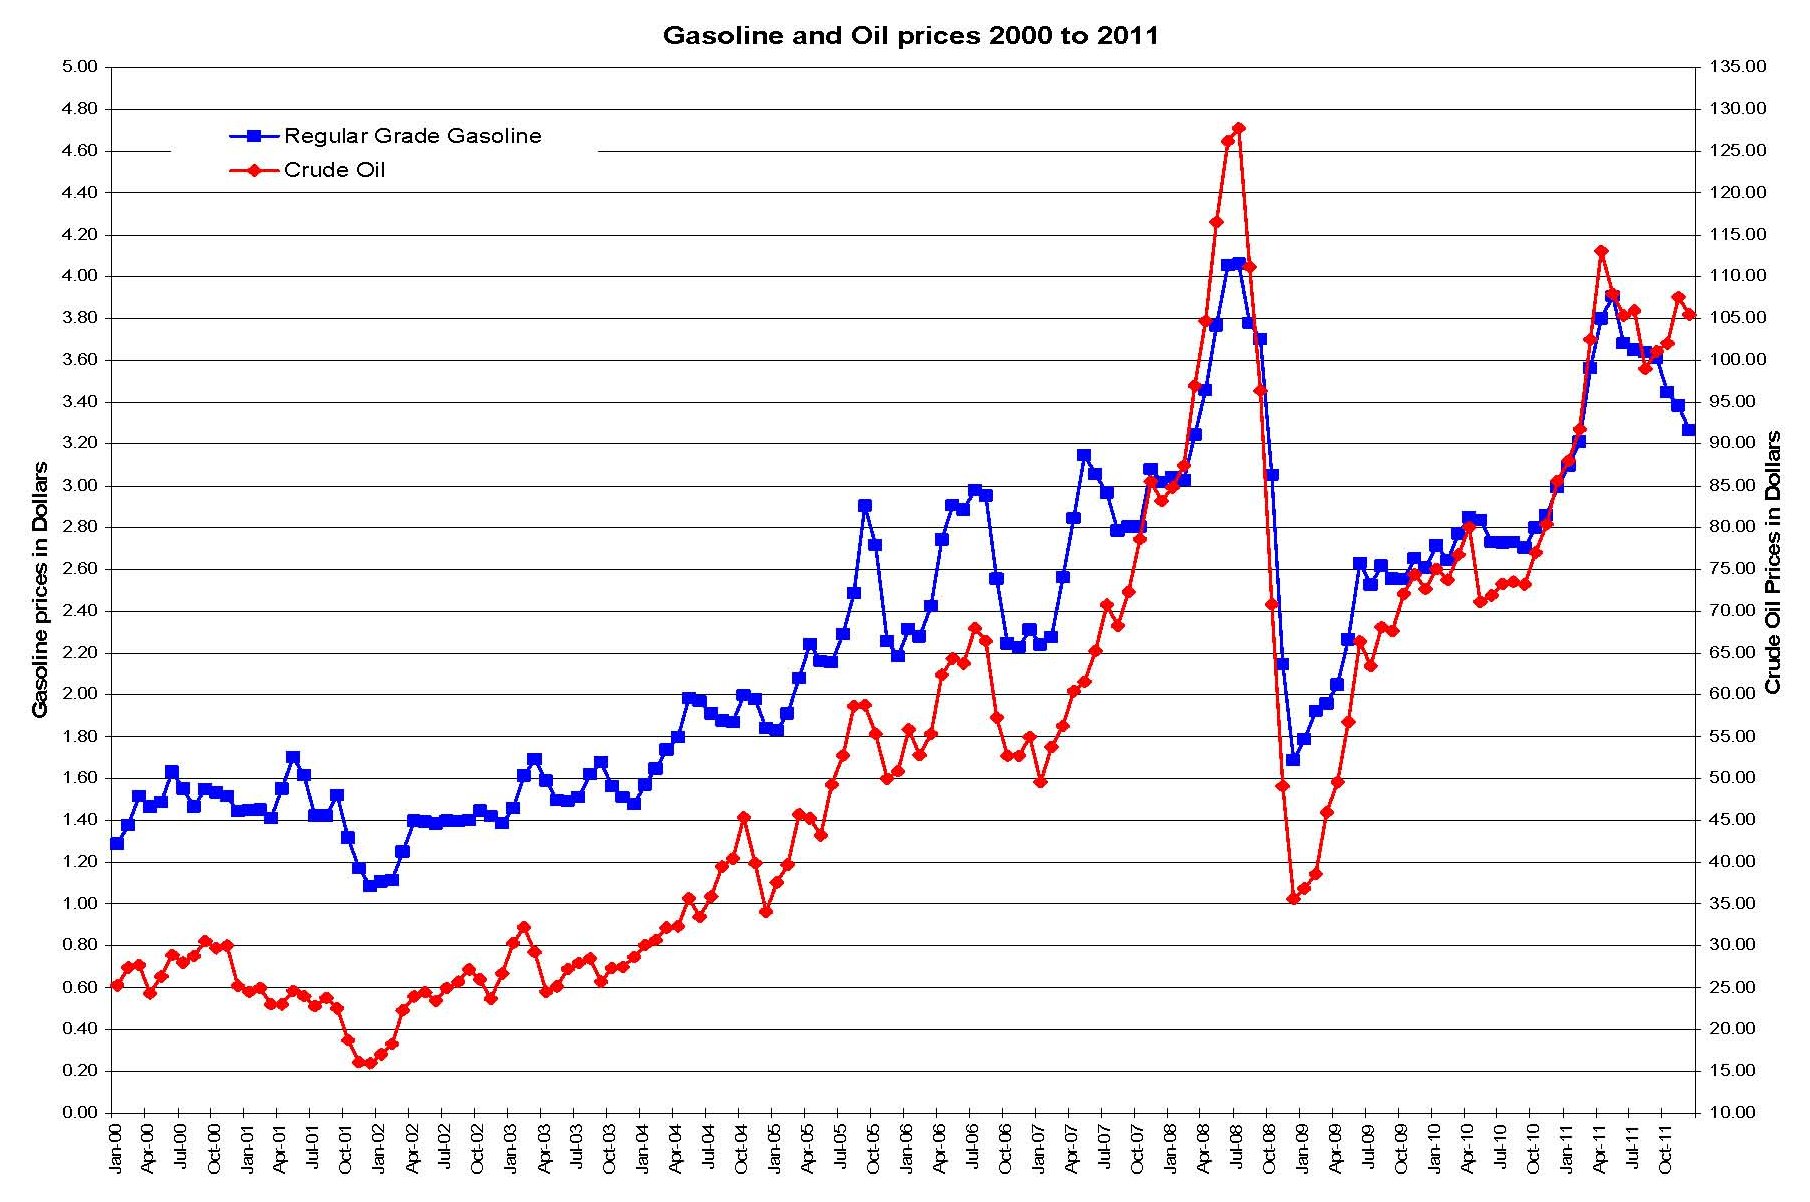
Gasoline has gone down in price and regardless of the political predictions of $5.00 per gallon of gas, the Energy Information Administration using actuarial tables, historical data, import and production expectations over the next two years give compelling evidence that gasoline will not exceed about $3.70 per gallon for regular grade.
High gasoline prices in 2008 were attributed to high crude oil prices. Gasoline went to an average price of $4.11 ($4.31 2012 value) per gallon for regular grade in July 2008; the highest in history. Gasoline prices for 2011 were for the most part, because of U.S. politics. The highest national average price at the pump came in at $3.96 ($3.99 2012 value) per gallon in May 2011. Gasoline was priced at $1.45 in January of 2001, by the end of George W. Bush’s last full month, December 2008 gasoline had risen and fallen sporadically and closed at $1.69 per gallon. When Barack Obama took office in January 2009 Gasoline closed at $1.79 per gallon that month.
During his first six months the price gasoline increased by 84 cents to $2.63 in June 2009. For the next 18 months, July 2009 to December 2010 prices had relatively stabilized and closed at $2.99. When the Republicans took the House of Representatives gasoline prices start to make a significant increase. Peaking in May 2011, at the close of 2011 gasoline had a national average of $3.27 a seventy cent drop. By the November 2012 elections gasoline prices will have stabilized and be doubled that when Obama took office. If he fails to retain the Presidency, his economic legacy will be clouded with half truths and high gasoline prices.
Part of the cost of gasoline is a federal sales tax of 48.1 cents per gallon. Although the federal excise tax on motor fuel is meant for road and bridge construction and maintenance, the fuel taxes collected go to the general fund. The federal excise is assessed on consumers and businesses to offset the losses from the oil subsidies. Every state also has additional taxes added to the cost; both state and federal taxes total 56.1 cents (Alaska) to 97.1 cents (New York) per gallon.
Click image for a larger view.
At the end of 1985 the U.S. had 451,124 active wells that produced almost 3.275 billion barrels of crude. From 1985 to 2009 we had a net loss of 87,665 of operating wells. 2008 marked the year in which we had the lowest crude production in 40 years, half of what we produced in 1985. Domestic production took an average loss of just under 63.6 million barrels a year from 1985 to 2008. At the close of 2009 there were 5,669 less wells than 2008 and produced 144,780,000 more barrels.
| Year |
Wells |
Barrels per Year |
Year |
Wells |
Barrels per Year |
| 1985 |
451,124 |
3,274,553,000 |
1999 |
358,710 |
2,146,732,000 |
| 1986 |
448,748 |
3,168,252,000 |
2000 |
359,188 |
2,130,706,000 |
| 1987 |
416,614 |
3,047,377,000 |
2001 |
358,739 |
2,117,512,000 |
| 1988 |
438,935 |
2,979,126,000 |
2002 |
354,640 |
2,097,124,000 |
| 1989 |
436,176 |
2,778,772,000 |
2003 |
351,127 |
2,073,454,000 |
| 1990 |
423,463 |
2,684,689,000 |
2004 |
350,404 |
1,983,300,000 |
| 1991 |
428,967 |
2,707,039,000 |
2005 |
350,778 |
1,890,107,000 |
| 1992 |
414,721 |
2,624,631,000 |
2006 |
356,544 |
1,862,259,000 |
| 1993 |
406,136 |
2,499,033,000 |
2007 |
358,334 |
1,848,450,000 |
| 1994 |
394,909 |
2,431,476,000 |
2008 |
369,128 |
1,811,816,000 |
| 1995 |
384,394 |
2,394,269,000 |
2009 |
363,459 |
1,956,596,000 |
| 1996 |
389,120 |
2,366,016,000 |
2010* |
363,459 |
1,998,137,000 |
| 1997 |
390,022 |
2,354,831,000 |
2011* |
363,459 |
2,059,970,000 |
| 1998 |
378,114 |
2,281,920,000 |
2010 & 2011 well
count are estimated |
Click image for a larger view.
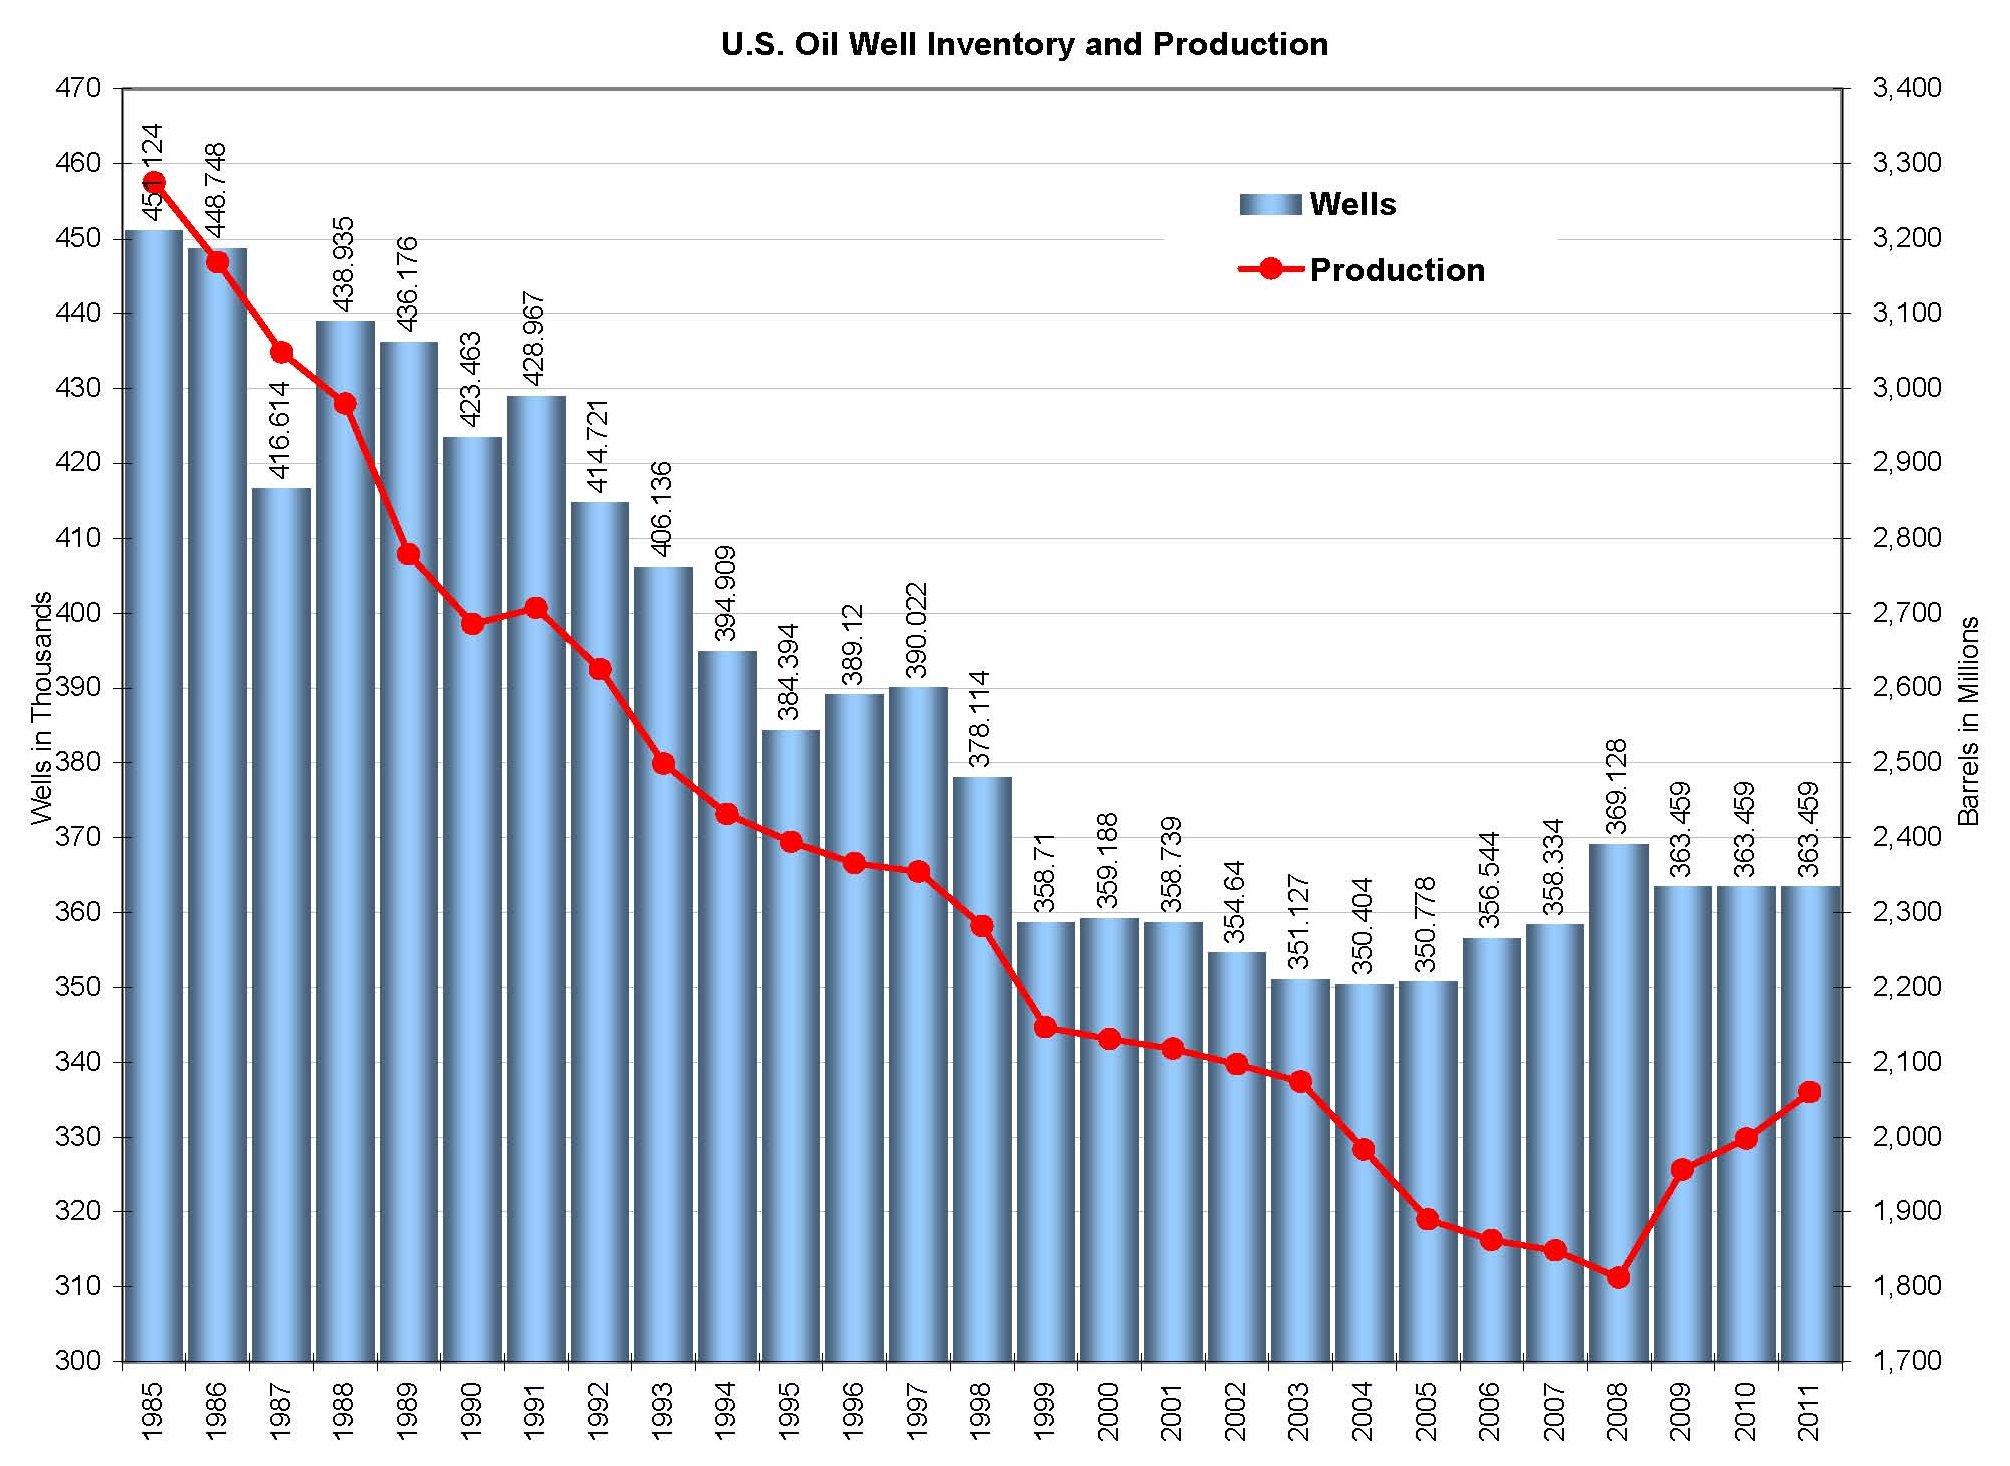
The last year we produced more oil than we imported was 1992. A slight increase of domestic production is shown for 2009, 2010 and 2011. Provided domestic production continues to rise at the rate indicated with existing or new wells, it will take another 10 years, or to 2021, before we gain ground on our import to production ratio. With almost 87,000 less wells in 2009 than what we had in 1985, we will need to start 30 wells per day everyday for the next eight years. The alternative is to reopen every closed well that still stands and is functional and can produce oil.
Using the inactive and viable wells, how much oil can be produced domestically?
| Oil Stock
Balances |
| Year |
Barrels Produced |
Barrels Imported |
Total Stock |
Import Percent of Total Stock |
| 1985 |
3,274,415,000 |
1,260,741,000 |
4,535,156,000 |
27.80% |
| 1986 |
3,168,200,000 |
1,634,788,000 |
4,802,988,000 |
34.04% |
| 1987 |
3,047,435,005 |
1,744,978,000 |
4,792,413,005 |
36.41% |
| 1988 |
2,971,100,000 |
1,887,860,000 |
4,858,960,000 |
38.85% |
| 1989 |
2,778,745,000 |
2,146,552,000 |
4,925,297,000 |
43.58% |
| 1990 |
2,684,687,055 |
2,216,604,000 |
4,901,291,055 |
45.22% |
| 1991 |
2,707,038,925 |
2,146,066,000 |
4,853,104,925 |
44.22% |
| 1992 |
2,617,459,895 |
2,294,570,000 |
4,912,029,895 |
46.71% |
| 1993 |
2,499,033,090 |
2,543,375,000 |
5,042,408,090 |
50.44% |
| 1994 |
2,431,475,970 |
2,704,197,000 |
5,135,672,970 |
52.66% |
| 1995 |
2,394,268,965 |
2,767,313,000 |
5,161,581,965 |
53.61% |
| 1996 |
2,359,551,625 |
2,893,646,000 |
5,253,197,625 |
55.08% |
| 1997 |
2,354,831,080 |
3,069,431,000 |
5,424,262,080 |
56.59% |
| 1998 |
2,281,919,045 |
3,242,712,000 |
5,524,631,045 |
58.70% |
| 1999 |
2,146,732,170 |
3,228,092,000 |
5,374,824,170 |
60.06% |
| 2000 |
2,124,884,365 |
3,399,240,000 |
5,524,124,365 |
61.53% |
| 2001 |
2,117,512,095 |
3,471,067,000 |
5,588,579,095 |
62.11% |
| 2002 |
2,097,123,925 |
3,418,022,000 |
5,515,145,925 |
61.98% |
| 2003 |
2,073,454,040 |
3,676,005,000 |
5,749,459,040 |
63.94% |
| 2004 |
1,977,880,980 |
3,820,979,000 |
5,798,859,980 |
65.89% |
| 2005 |
1,890,106,875 |
3,754,671,000 |
5,644,777,875 |
66.52% |
| 2006 |
1,862,258,835 |
3,734,226,000 |
5,596,484,835 |
66.72% |
| 2007 |
1,848,450,155 |
3,690,568,000 |
5,539,018,155 |
66.63% |
| 2008 |
1,806,865,705 |
3,590,628,000 |
5,397,493,705 |
66.52% |
| 2009 |
1,956,596,005 |
3,314,787,000 |
5,271,383,005 |
62.88% |
| 2010 |
1,998,137,020 |
3,377,077,000 |
5,375,214,020 |
62.83% |
| 2011 |
2,059,970,000 |
3,806,614,000 |
5,866,584,000 |
64.89% |
Click image for a larger view.
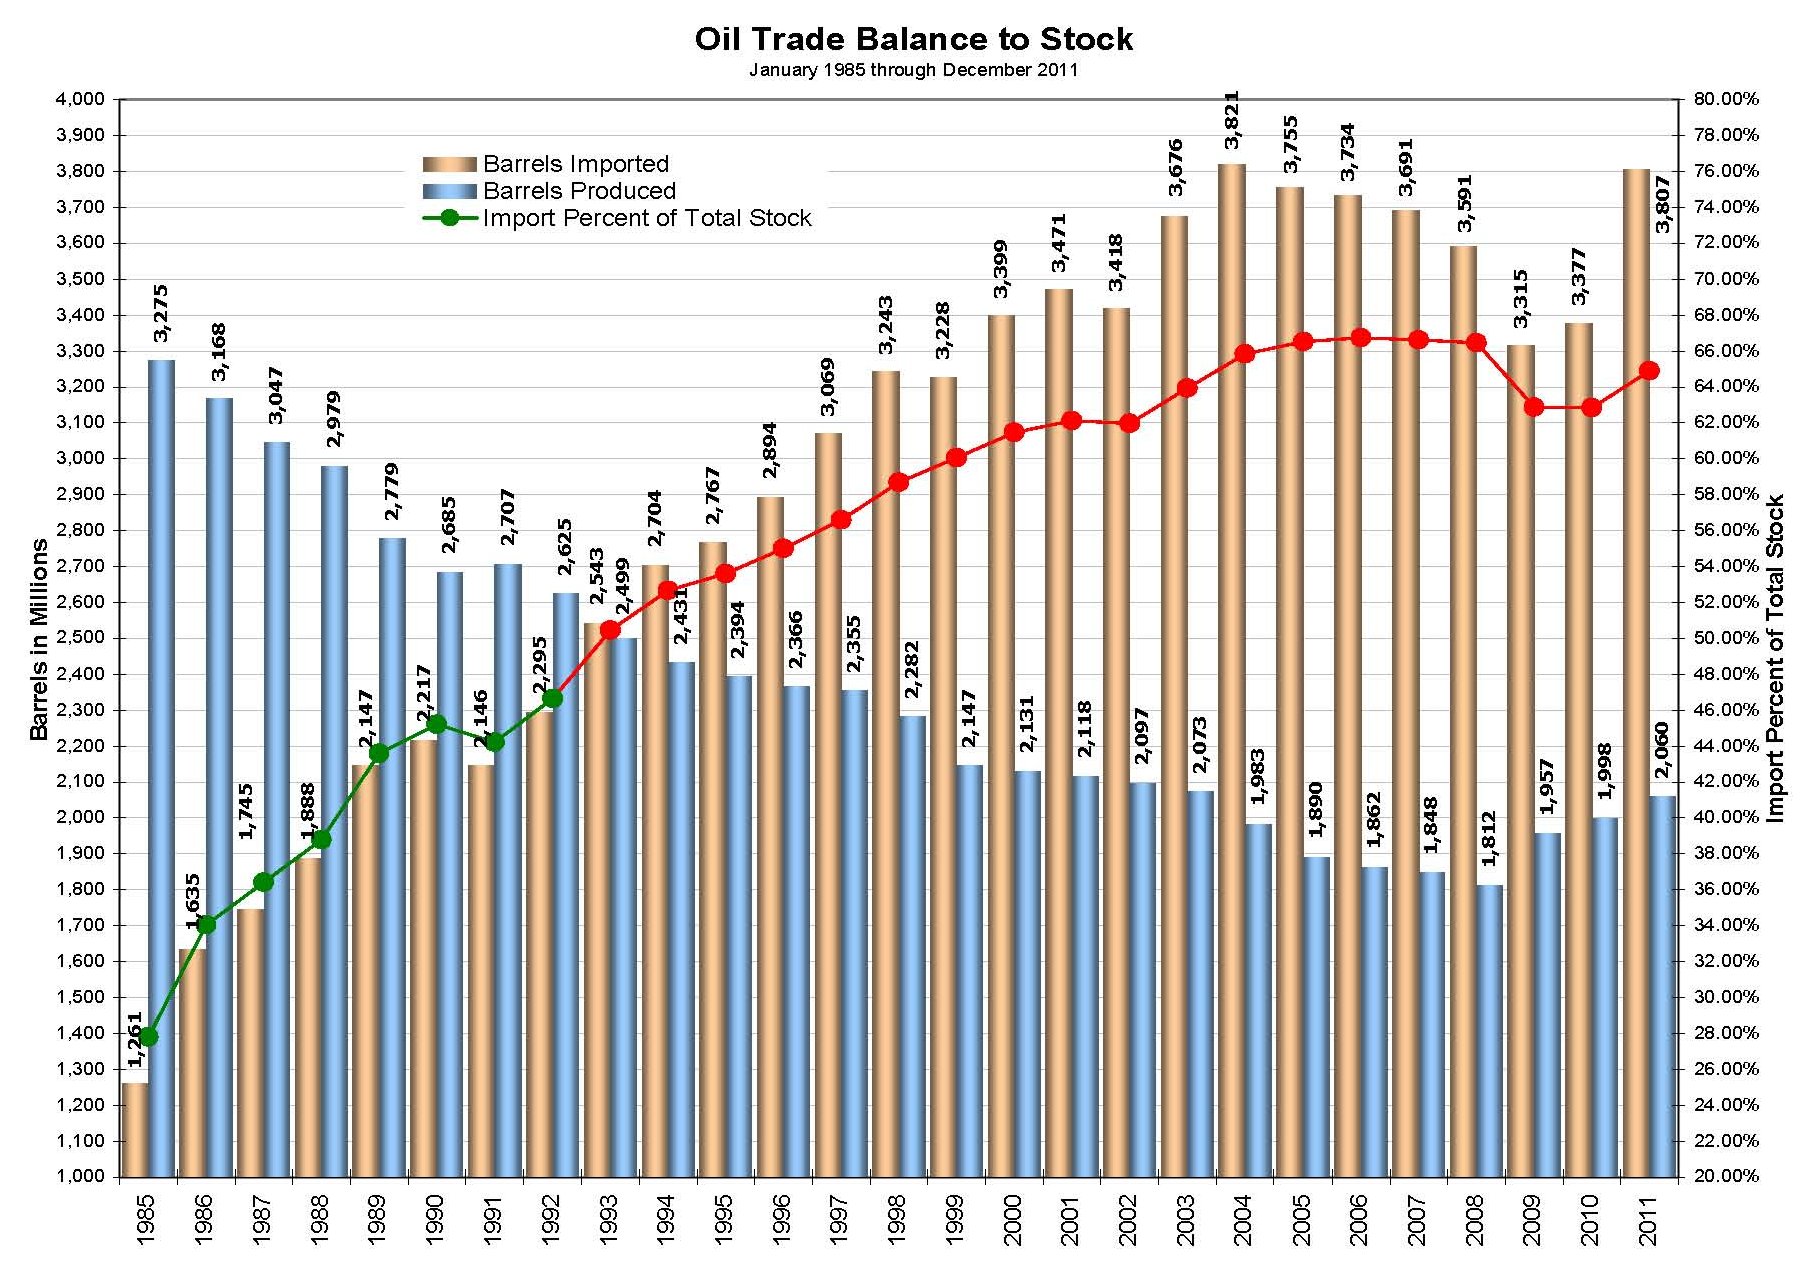
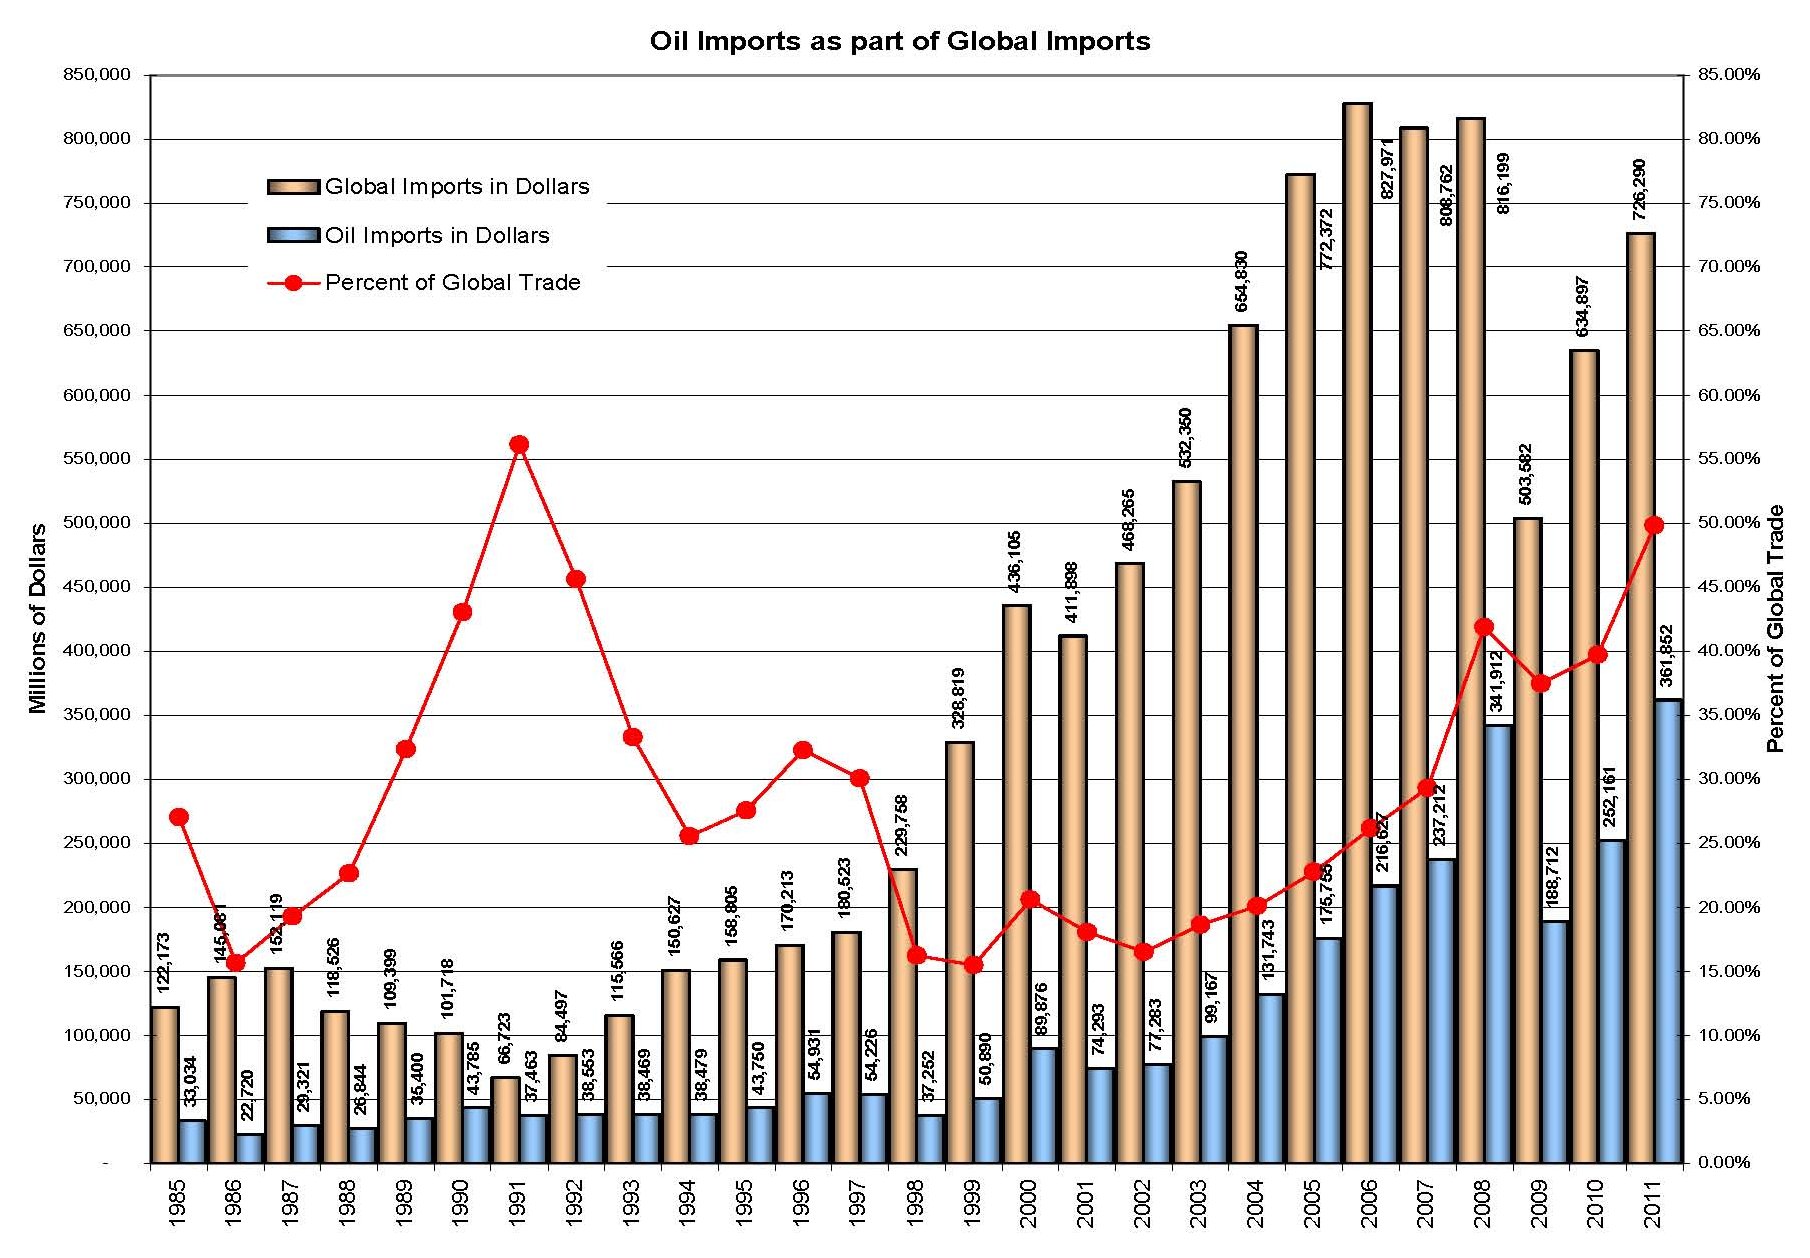
The effect of oil on trade with our global trading partners is profound. Of the 25 years covered, only 11 those years less than 25% of all products imported was oil. The year in which imported less products, 1991, oil was 53.15% of those imports, the highest percentage of any other year. The year with the best oil to all imports was 1999, with 15.48%. Imports, both oil and other products, dropped in 2009; this would be contributable to the economic status of the U.S. economy. Oil imports for 2009 were lower than the 2006 level. 2010 added around $65 billion in oil and $130 billion in other imports, products were still lower than 2004 and oil lower than 2008. From 2002 through 2007, there was a steady increase of oil imports with a spike year-over-year for 2008.
Given the rates of imports for both, it is not unreasonable to see that imports for both will reach 2008 levels for 2011 and more for 2012. In fact, it is quite possible that by the end of 2013, 50% of all imports will be oil, and very possible that our total imports will hit $1 trillion.
| Oil as a
Percent of Global Trade in Dollars |
| Year |
Global Imports |
Global Oil
Imports |
Percent of
Global Trade |
| 1985 |
122,173,000,000 |
33,034,436,000 |
27.04% |
| 1986 |
145,081,000,000 |
22,720,478,000 |
15.66% |
| 1987 |
152,119,100,000 |
29,320,515,000 |
19.27% |
| 1988 |
118,525,900,000 |
26,844,064,000 |
22.65% |
| 1989 |
109,399,400,000 |
35,400,217,000 |
32.36% |
| 1990 |
101,718,400,000 |
43,784,833,000 |
43.05% |
| 1991 |
66,723,100,000 |
37,463,467,000 |
56.15% |
| 1992 |
84,497,200,000 |
38,553,055,000 |
45.63% |
| 1993 |
115,566,300,000 |
38,469,376,000 |
33.29% |
| 1994 |
150,626,700,000 |
38,479,417,000 |
25.55% |
| 1995 |
158,804,600,000 |
43,749,653,000 |
27.55% |
| 1996 |
170,213,300,000 |
54,930,857,000 |
32.27% |
| 1997 |
180,523,000,000 |
54,225,907,000 |
30.04% |
| 1998 |
229,758,200,000 |
37,252,222,000 |
16.21% |
| 1999 |
328,818,800,000 |
50,889,621,000 |
15.48% |
| 2000 |
436,104,600,000 |
89,876,433,000 |
20.61% |
| 2001 |
411,897,500,000 |
74,292,894,000 |
18.04% |
| 2002 |
468,265,000,000 |
77,283,331,000 |
16.50% |
| 2003 |
532,350,267,974 |
99,167,173,000 |
18.63% |
| 2004 |
654,830,346,345 |
131,742,665,000 |
20.12% |
| 2005 |
772,372,187,455 |
175,755,341,000 |
22.76% |
| 2006 |
827,970,502,637 |
216,627,331,000 |
26.16% |
| 2007 |
808,762,277,809 |
237,211,653,000 |
29.33% |
| 2008 |
816,198,714,214 |
341,912,488,000 |
41.89% |
| 2009 |
503,581,850,449 |
188,711,776,000 |
37.47% |
| 2010 |
634,896,848,342 |
252,160,511,000 |
39.72% |
| 2011 |
726,289,646,999 |
361,852,497,333 |
49.82% |
Click image for a larger view.
Import/export data for Oil can be obtained from:
Census Bureau - Foreign Trade.
Energy Information Administration - Distribution and Production of Oil and Gas Wells by State
Energy Information Administration - Short-Term Energy Outlook - Prices
Energy Information Administration - Short-Term Energy Outlook - Real Prices Viewer