China offers two things for U.S. based manufacturers; unregulated labor and unregulated environmental conditions. U.S. manufacturers prefer contracting with factory owners in China rather than constructing their own facilities. The primary reason is so that the American company can claim ignorance to employee maltreatment and environmental missteps. The most common response from U.S. companies is "Because these are contracted factories, we have no control over the factory, employee relations and environmental conditions." We rely on governmental agencies in those countries to enforce their own regulations and laws. This self-exoneration is used by U.S. manufacturers of any management responsibilities to American consumers and U.S. government regulators.
China is included because of our current trade arrangements and on June 22 2011, Congressman Ed Royce of California presented a potential Free Trade Agreement to the U.S. House of Representatives in an effort to send more jobs to China. The pretense of this trade agreement is to increase U.S. imports to China to a more open market for U.S. products. What this Representative knows and has not stated is that as much as 60% of the products exported from China are American. These products are already available to Chinese consumers out of the “back door” of factories through theft and then into the open market under the ever watchful eye of the Chinese government and U.S. manufacturers.
Product piracy is rampant in China. Most products that are pirated are technology based. One report by Reuters puts a cost of $48 billion in 2009. Some Congressional investigations have put that cost much higher, but actual costs are not known as manufacturers are reluctant to report the losses, instead these are hidden in tax reports under various deductions. Although the Chinese government does report that it frequently makes “crackdown” arrests and confiscation, ironically, many of these products are manufactured in state owned or partially state owned enterprises. American brand products that are commonly pirated in and by China are technology based such as internal parts for computers, high value retail clothing and accessory products, pre-recorded media and computer software. U.S. military hardware obtained through black-market networks and friendly countries became a public concern in 2011 when U.S. Navy Seals killed Osama bin Laden, key parts of a partially destroyed helicopter were cannibalized by Chinese government representatives with cooperation by the Pakistani government.
The accusations of currency manipulation against China have been prevalent for over 30 years. Economics Help gives a good explanation as to what it is. Keeping the yuan undervalued helps to boost demand for Chinese exports and therefore Chinese jobs. This practice keeps the dollar strong, US exports become less competitive. Also by keeping the dollar strong to the Chinese Yuan, it makes Chinese imports relatively more attractive, increasing foreign demand at the expense of domestic producers. The US argues this loss of demand and jobs is something it can’t afford at its particular stage in the economic cycle. U.S. manufacturers would take advantage of this because they wouldn’t have to pay a fair market value for operations within China. This creates an uncompetitive market for U.S. domestic products on the global market, especially to the Asian markets.
At the end of 2008 the average hourly wages for manufacturing in China was $1.36. Assuming a 40 hour work week, no other benefits for compensation such as medical, vacation, paid holidays or bonuses, this would equate to annual gross wages of $2,829. By comparison the U.S. median household income for 2008 was 50,303, $24.18 per hour (based on 2,080 hour work year). Recent news reports, however, have put Chinese factory labor pay at 70 cents per hour, with an average 12 hour day six days a week. Chinese law does not require overtime pay or other employee benefits; gross annual pay at that rate becomes roughly $2,620.
We import more American products from China than we import from any other country in the world. We import more American branded products from China than we export to the rest of the world. Without exception, every major U.S. manufacturer imported products from China in 2011 and has for over 20 years. Labor costs in China, was a major attraction to American manufacturers but the cost of relocating American jobs offshore was expensive. Manufacturers and their lobbyists spent large sums of money on campaign financing and other recently legalized kickbacks and payoffs to the members of Congress to get tax breaks for themselves and their clients. One the first changes to the tax code was overseas earnings, individuals and companies were allowed up to $60,000 tax free earnings. The code changed so that individuals could still earn up to that $60,000 tax free, businesses were separated and given up to their first $100 million earned as tax-free income. Import tariffs went next; the condition was that the product had to have an American corporation as the brand name.
Now that the American manufacturers do not have to pay import tariffs on products from China or other countries into the U.S. potential income was seen as unlimited. With all of the tax breaks provided within the U.S. tax code, most if not all American branded products imported from China and other countries it is possible that American manufacturers paid no taxes for their foreign made products. Non-American products imported from China are assessed from 0% to 40% of retail value, with a rough average of 20% the potential loss of tariff revenue is about $145 billion for 2011 for American branded products. Because U.S. based companies, both public and private, aren’t required to report what taxes were avoided, the real cost can only be speculated; even by the Internal Revenue Service.
The first products to leave the U.S. for manufacturing in China were plastics. If it was small and made of plastic, it went to China and returned to become parts in cars, large and small household appliances, furniture and kitchen & dining room ware. With the lack of environmental regulations in China more American manufacturing jobs started leaving the U.S. by the hundreds of thousands; eventually totaling 2 million middle-class American jobs. In 2009 one entire product group had all but disappeared; toys. The last major toy manufacturer to leave the United States was Mattel.
The next product group was home and personal electronics. American brands were starting to get bought up by the Asian brands; those that weren’t bought went out of business. From radio alarm clocks to televisions, there are none being made in the United States. Only one company assembles televisions in America with components predominantly imported from China. Computers and other digital products for consumers, business, government and military applications are made almost exclusively in China. One of the largest Chinese companies is Foxconn, which manufactures products for most of America’s largest electronics corporations.
The next two tables will show that the raw and preprocessed materials that were exported
and then returned to the U.S. as finished American brand products.
These are the top 20 American products imported from China5 in 2011 in real dollars, to
compare to 2012 dollars multiply by 1.0076712. The second largest commodity that went out in 2011, semiconductors, preprocessed technology components, exported from the U.S. were $6.5 billion, and returned as $76 billion in computers and telecommunications products.
| Product Group |
Imports from China
in Dollars |
Global Imports
in Dollars |
Percent of
Global Imports |
| Computers |
47,213,722,193 |
64,904,016,437 |
72.74% |
| Other (clocks, port typewriters, household gds |
40,433,525,380 |
77,678,889,383 |
52.05% |
| Computer accessories, peripherals and parts |
27,657,204,518 |
54,794,447,860 |
50.47% |
| Toys, shooting and sporting goods, and bicycles |
25,311,363,786 |
32,957,158,062 |
76.80% |
| Apparel and household goods-other textiles |
19,752,073,162 |
36,955,235,194 |
53.45% |
| Telecommunications equipment |
17,335,292,495 |
48,457,425,472 |
35.77% |
| Apparel and household goods-cotton |
16,481,180,248 |
50,381,999,510 |
32.71% |
| Footwear of leather, rubber, or other materials |
14,089,520,054 |
18,348,103,348 |
76.79% |
| Furniture, household items, baskets |
13,750,112,894 |
23,623,269,713 |
58.21% |
| Electric apparatus and parts, n.e.c. |
12,948,171,140 |
41,538,400,164 |
31.17% |
| Television receivers, vcr's & other video equip. |
11,823,020,442 |
33,486,023,935 |
35.31% |
| Household and kitchen appliances |
10,212,362,365 |
33,486,023,935 |
30.50% |
| Other parts and accessories-vehicles |
9,028,900,584 |
76,804,471,786 |
11.76% |
| Other industrial machinery |
6,566,996,102 |
44,945,256,556 |
14.61% |
| Semiconductors and related devices |
6,059,507,523 |
37,938,292,508 |
15.97% |
| Other (boxes, belting, glass, abrasives, etc.) |
5,722,615,238 |
26,546,720,174 |
21.56% |
| Photo and service industry machnery & trade tools |
5,721,941,225 |
15,162,012,119 |
37.74% |
| Nontextile apparel and household goods |
5,290,349,733 |
8,050,162,162 |
65.72% |
| Cookware, cutlery, house and garden wares, tools |
5,154,395,689 |
7,458,951,530 |
69.10% |
| Sporting and camping apparel, footwear and gear |
4,800,591,205 |
8,630,728,773 |
55.62% |
These are the top 20 American products exported to China in 2011 in real dollars. Everything in the top 20, including the soybeans, is trans-shipped to manufacture American branded products in other countries, to include China.
| Product Group |
Exports to China in Dollars |
Global Exports
in Dollars |
Percent of Global Exports |
| Soybeans |
10,452,164,796 |
18,041,648,798 |
57.93% |
| Civilian aircraft, engines, equipment, and parts |
6,382,378,228 |
80,172,454,470 |
7.96% |
| Passenger cars, new and used |
5,303,714,235 |
47,354,593,365 |
11.20% |
| Semiconductors |
4,585,157,753 |
43,773,152,276 |
10.47% |
| Copper |
4,312,455,884 |
8,480,823,271 |
50.85% |
| Industrial machines, other |
4,153,775,451 |
45,246,225,629 |
9.18% |
| Pulpwood and woodpulp |
3,998,322,421 |
10,155,543,232 |
39.37% |
| Plastic materials |
3,832,923,628 |
36,025,994,150 |
10.64% |
| Chemicals-organic |
3,180,034,442 |
39,419,030,345 |
8.07% |
| Aluminum and alumina |
2,949,283,276 |
9,528,015,984 |
30.95% |
| Steelmaking materials |
2,732,843,378 |
14,785,564,163 |
18.48% |
| Chemicals-other |
2,652,712,468 |
28,783,602,478 |
9.22% |
| Cotton, raw |
2,632,411,578 |
8,505,729,661 |
30.95% |
| Measuring, testing, control instruments |
2,383,994,737 |
23,742,788,374 |
10.04% |
| Industrial engines |
1,979,155,070 |
28,102,493,451 |
7.04% |
| Medicinal equipment |
1,909,729,642 |
32,041,186,500 |
5.96% |
| Logs and lumber |
1,872,037,827 |
5,618,234,659 |
33.32% |
| Electric apparatus |
1,833,590,623 |
35,118,902,366 |
5.22% |
| Other industrial supplies |
1,631,950,792 |
22,985,042,545 |
7.10% |
| Petroleum products, other |
1,462,572,328 |
54,237,010,317 |
2.70% |
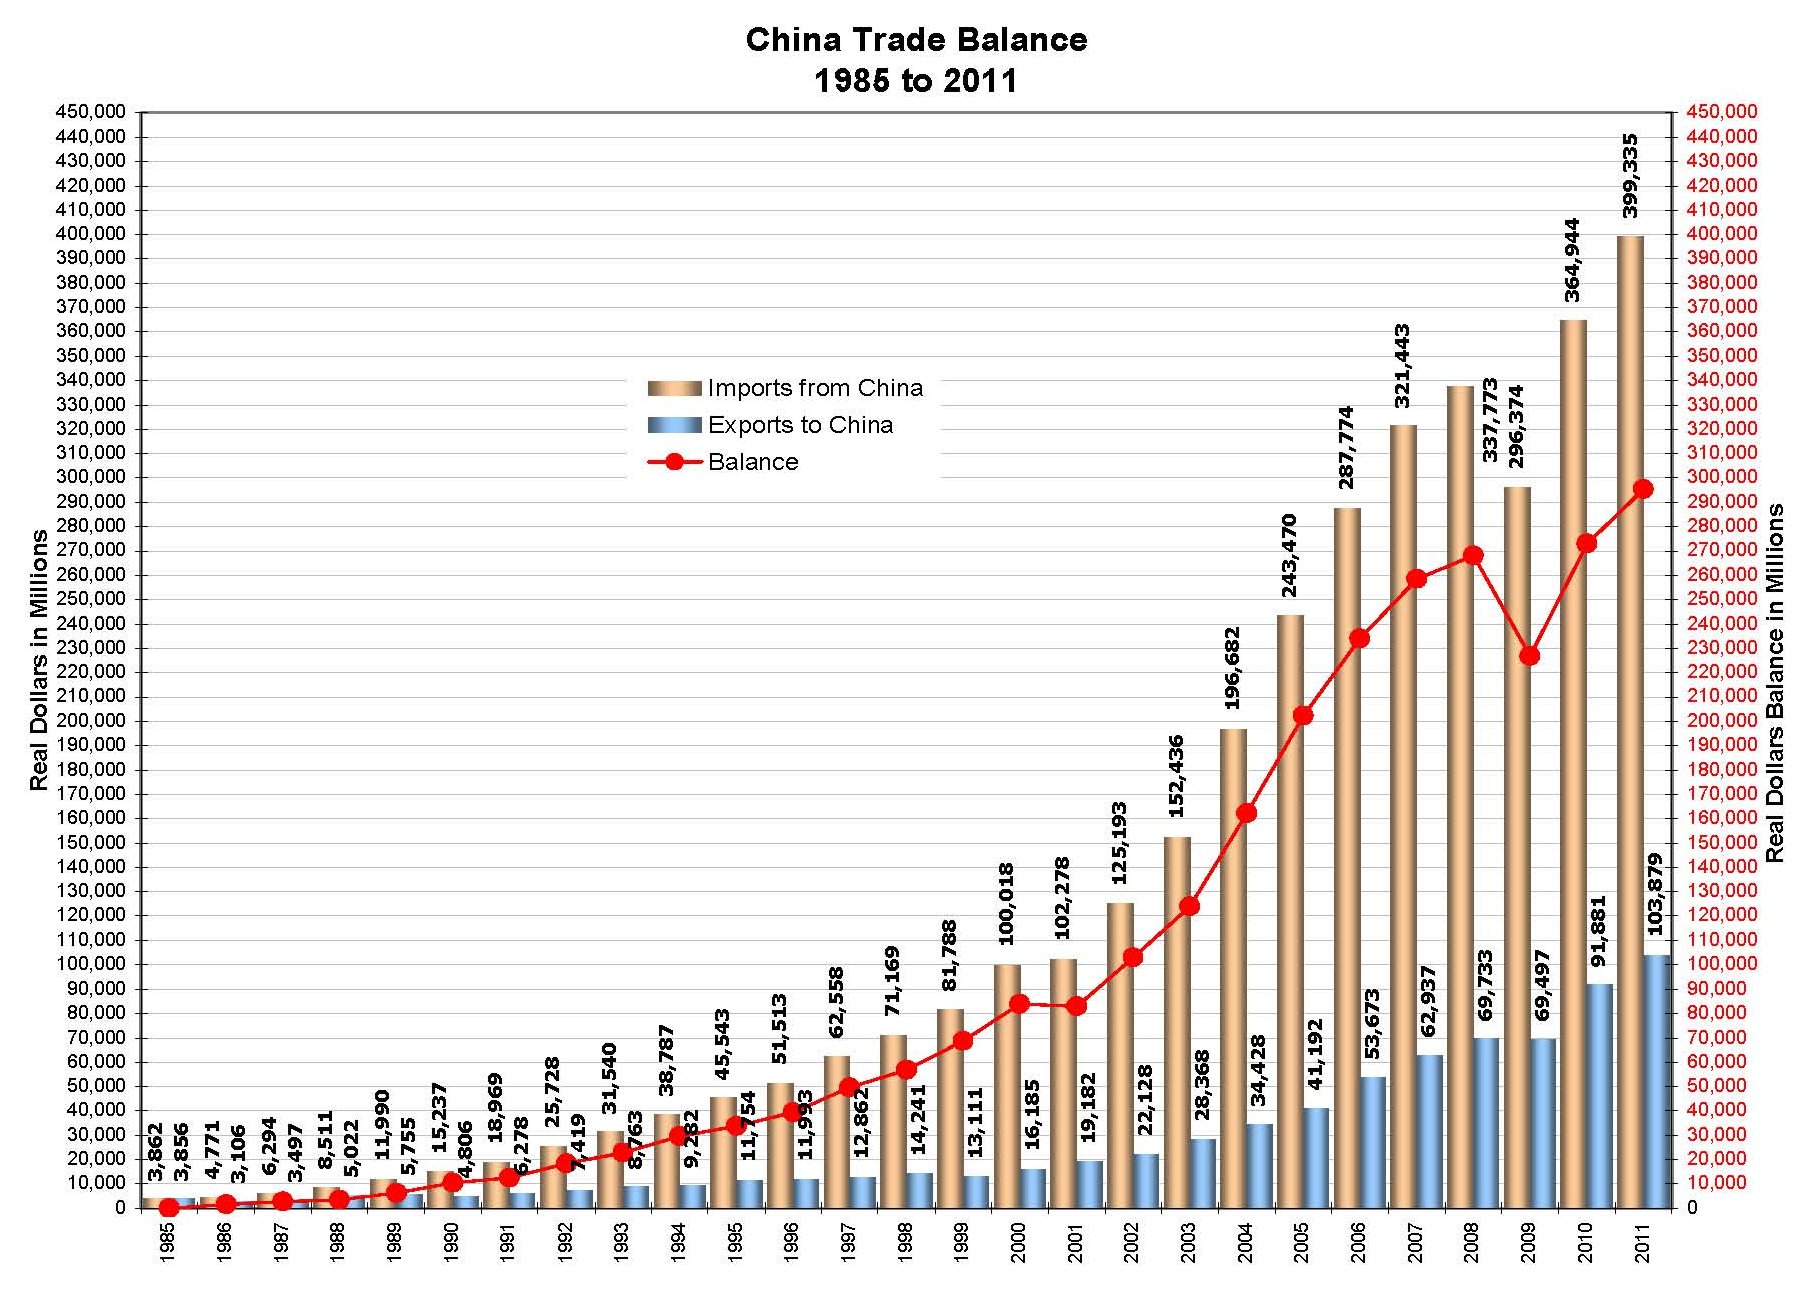
Although 1985 was not the first year we had a trade deficit with China, it was the last year our trade deficit was in the millions of dollars; 1986 was the first year our trade deficit went past $1 billion. Our trade deficit 1986 was $1,664,700,000; 227.45 times what our deficit was in 1985. With the financial deregulations from the late President Reagan $1.665 billions dollars worth of manufacturing jobs helped to trigger the recession of the late 1980s. The first year our trade deficit surpassed our exports was 1989, starting in 1991 our deficit started to double our exports with China, 1997 through 2002 deficits were quadrupled of our exports. Our trade deficit with China has been five times our exports since 2003.
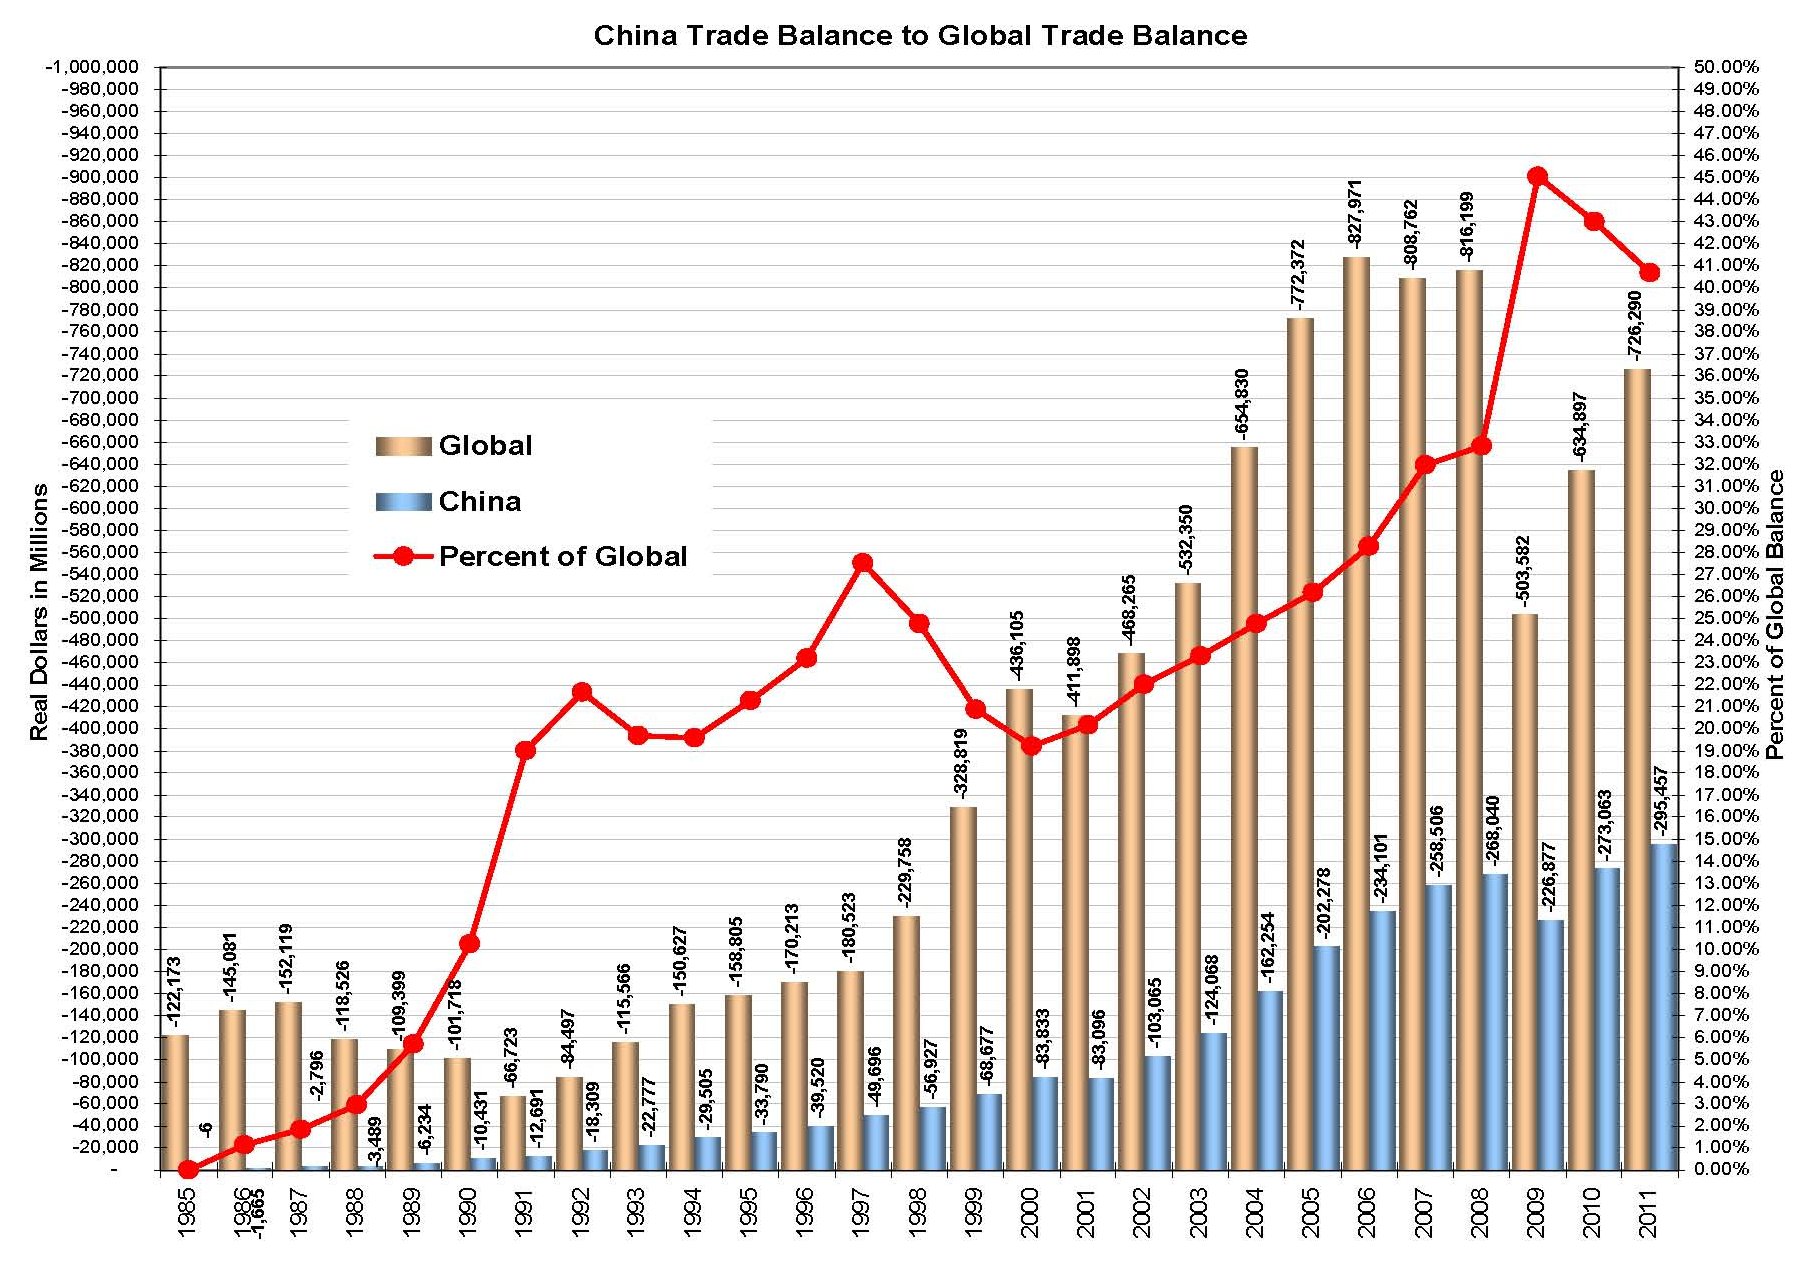
Relative to our global trade, China hold a majority of our trade deficit ending with 40.68% for 2011. The highest percent relative to our global trade deficit was 45.05% ($234 billion) in 2009 even though our actual trade deficit with China was lower than in 2006 which was at 28.27% ($226.9 billion). The appearance of the percentage of trade deficit of China relative to global deficits seems to be lower; the actual deficit in dollars continues to increase for both. The possible deficit globally by the end of 2012 may reach $840 billion and $330 billion with China, that equates to about 39.29% of global trade.
Click image for a larger view.
Import/export data for trade with China can be obtained from:
Census Bureau - Foreign Trade
Reuters - China piracy cost U.S. firms $48 billion in 2009
Economics Help - Chinese Currency Manipulation
Census Bureau - Historical Income Tables: Households - /2010/H08_2010.xls
Bureau of Labor Statistics - International Labor Comparisons - Manufacturing in China
Bureau of Labor Statistics - CPI Inflation Calculator