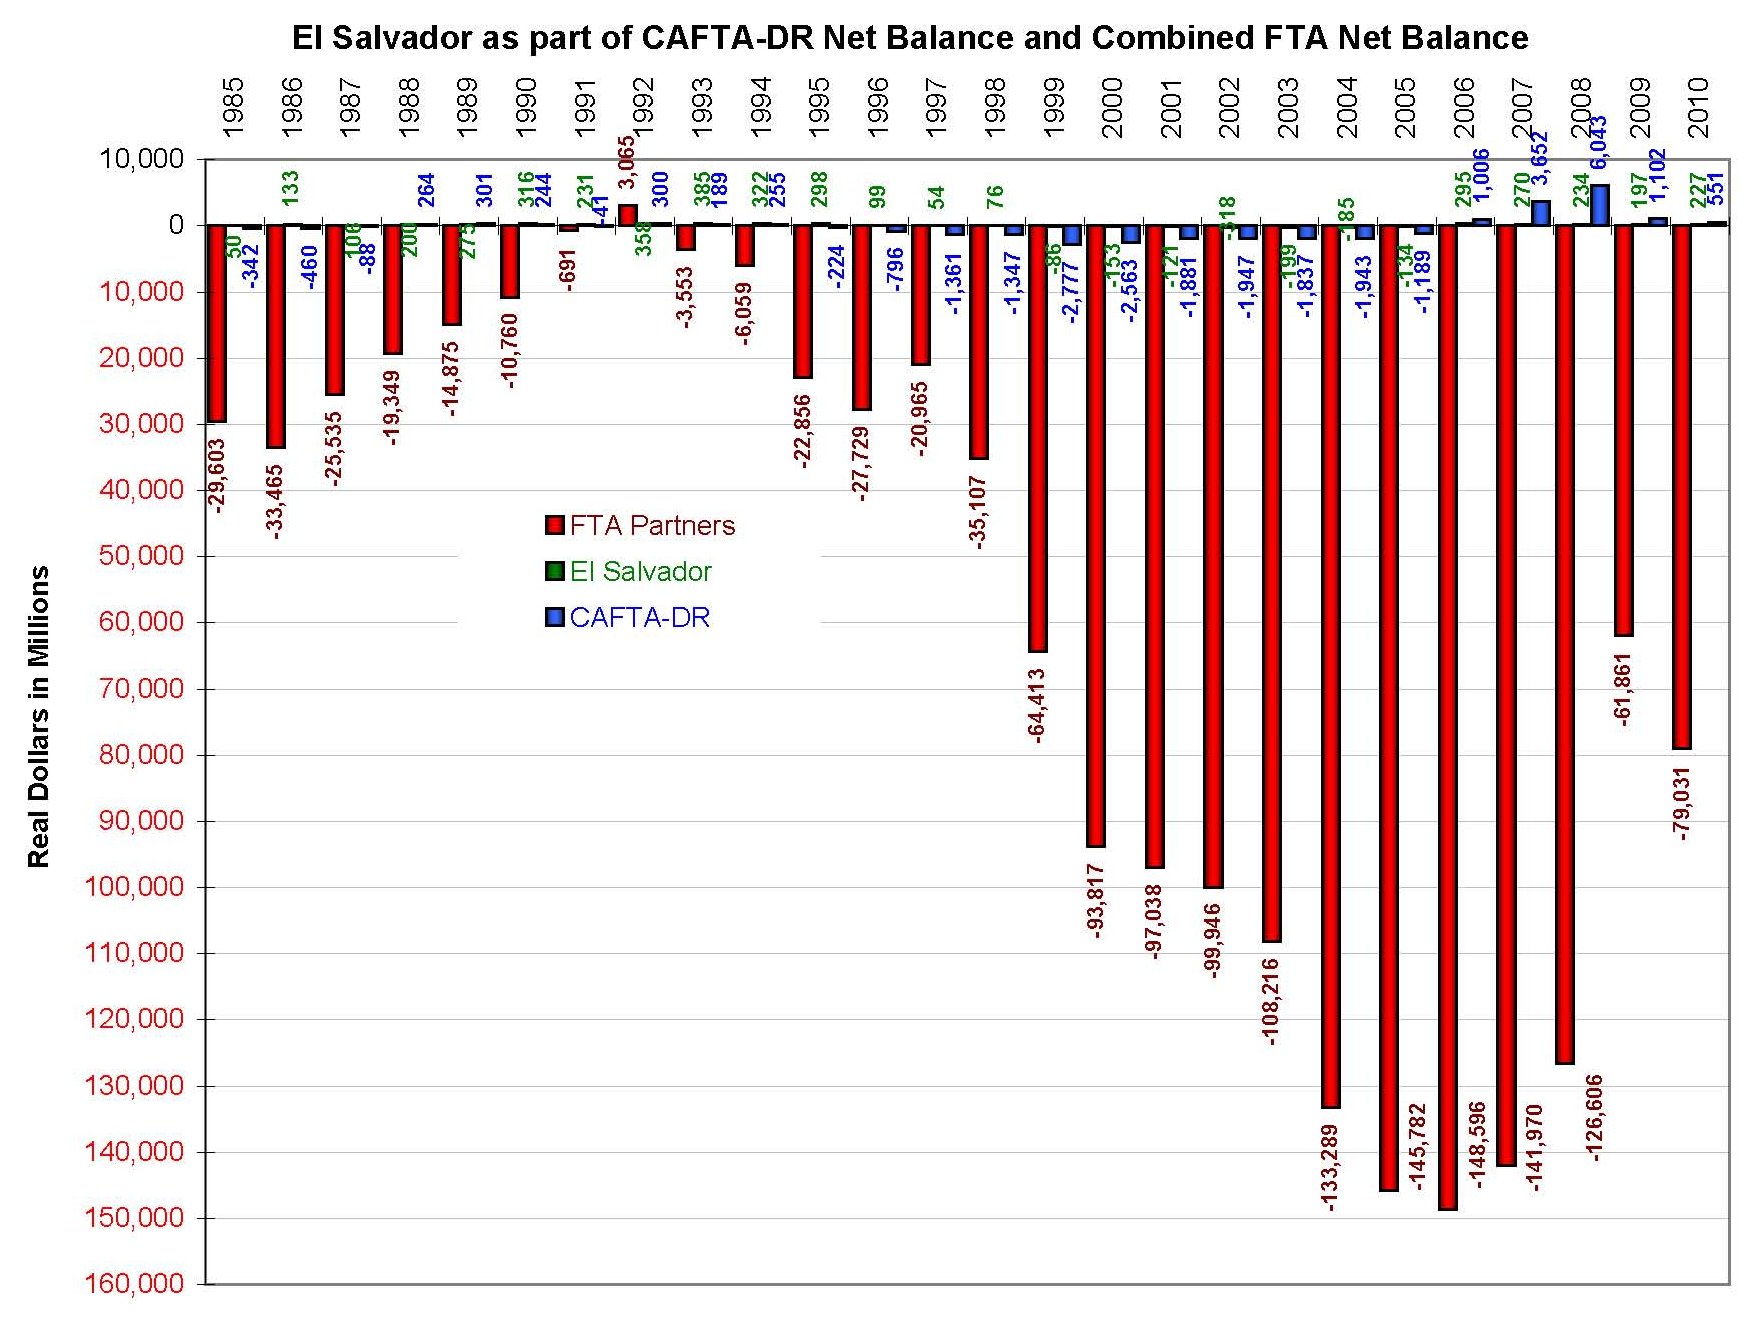
Ratified in 2006, El Salvador was the first country of the CAFTA-DR FTAs. With the same intent, and failure, of the other Central American countries in this trade agreement; trading illegal drug industry jobs were suppose to be replaced with manufacturing and agricultural employment opportunities.
President Barack Obama issued a memorandum to the United States Secretary of State Hillary Clinton on September 15, 2011, stating that among the Central American countries, El Salvador tops the concerns of the United States regarding drug trafficking and production. American manufacturing has facilitated this with the increased ground transportation of American products being carried to the United States.
Senior Salvadoran and U.S. political officials are helpless to change the illegal drug industry in El Salvador probably more than any other country in Central America for one major reason, economics. This is, again, for the same reason as is with the Costa Rican government, low level Salvadoran government employees. These low level employees, especially law enforcement personnel, are easily bribed and blackmailed into cooperating with the drug cartels.
The median income for Salvadorans in 2009 was $3,430 per year. When considering the income that they can earn helping drug cartels, standard wages manufacturing American products are not as attractive. Most of the illegal drugs manufactured in South America and southern Central America pass through El Salvador and Belize, through Costa Rica into Mexico. When locals are able to earn up to 10 times what U.S. manufacturers pay, the drug cartels will continue to successfully recruit them as contracted employees.
Mostly American branded products were imported from El Salvador such as clothing, knick-knacks, construction materials and miscellaneous household staples. Agriculture products were somewhat present, although some of that was likely imported to El Salvador from other Central American countries through it’s participation in the Central American Common Market.
| Product Group |
El Saladore Imports |
CAFTA-DR Imports |
Percent of CAFTA-DR Imports |
| Apparel and household goods-cotton |
1,151,436,044 |
4,718,023,166 |
24.41% |
| Apparel and household goods-other textiles |
502,435,277 |
2,346,006,341 |
21.42% |
| Nonmonetary gold |
95,630,526 |
844,500,244 |
11.32% |
| Green coffee |
78,801,163 |
772,306,507 |
10.20% |
| U.S. goods returned, and reimports |
73,775,360 |
380,578,988 |
19.39% |
| Cane and beet sugar |
72,364,329 |
521,169,676 |
13.88% |
| Electric apparatus and parts, n.e.c. |
26,850,362 |
526,009,307 |
5.10% |
| Other (soft beverages, processed coffee, etc.) |
20,785,327 |
141,406,939 |
14.70% |
| Sporting and camping apparel, footwear and gear |
17,036,386 |
81,720,076 |
20.85% |
| Footwear of leather, rubber, or other materials |
13,381,697 |
189,745,323 |
7.05% |
| Bakery and confectionary products |
13,256,747 |
35,033,242 |
37.84% |
| Vegetables and preparations |
11,786,432 |
295,783,322 |
3.98% |
| Other (boxes, belting, glass, abrasives, etc.) |
10,292,237 |
157,262,941 |
6.54% |
| Fish and shellfish |
10,234,877 |
360,956,436 |
2.84% |
| Fuel oil |
10,017,505 |
14,209,607 |
70.50% |
| Woodworking, glass working, & plastic & rubber mch |
9,108,644 |
11,322,256 |
80.45% |
| Other (tobacco, waxes, nonfood oils) |
8,975,850 |
171,266,418 |
5.24% |
| Other (movies, misc imports, and spec transactions |
7,858,839 |
14,324,102 |
54.86% |
| Bauxite and aluminum |
7,734,978 |
31,414,004 |
24.62% |
| Other-finished (shingles, molding, wallboard, etc) |
7,301,811 |
28,217,920 |
25.88% |
Upon close inspection and comparison of these top 20 product groups to what we import from China, what we exported, with the exception of the agriculture products, we exported more non-"Made in USA" products than agriculture products. Like most of our other free trade partners, what we export was previously imported from the countries with which we have trade deficits.
The minimal amount of exports did nothing to stop or even slow down the drug trade through and from South and Central America. By looking at the products we exported to El Salvador, it’s obvious to see what was likely used to facilitate the continued illegal drug trade. In fact, products such as the fuel oil, aircraft parts and other petroleum products may very well be assisting in the growth of the illegal drug trade.
| Product Group |
El Salvadore Exports |
CAFTA-DR Exports |
Percent of CAFTA-DR Exports |
| Fuel oil |
187,555,016 |
2,179,249,556 |
65.68% |
| Cotton fiber cloth |
175,718,563 |
1,404,241,775 |
22.13% |
| Petroleum products, other |
137,840,913 |
1,438,129,070 |
13.72% |
| Plastic materials |
127,963,724 |
858,807,469 |
41.59% |
| Manmade cloth |
118,777,411 |
808,225,020 |
19.31% |
| Apparel, household goods - textile |
100,409,495 |
519,433,367 |
61.97% |
| Minimum value shipments |
97,668,989 |
969,394,296 |
81.95% |
| Civilian aircraft, engines, equipment, and parts |
93,604,134 |
235,775,595 |
41.71% |
| Corn |
87,858,467 |
620,780,285 |
20.99% |
| Pharmaceutical preparations |
75,500,197 |
582,593,098 |
28.29% |
| Other household goods |
61,974,701 |
378,513,883 |
17.58% |
| Newsprint |
59,498,681 |
671,630,649 |
36.43% |
| Animal feeds, n.e.c. |
58,911,331 |
424,976,806 |
27.12% |
| Cotton, raw |
57,933,592 |
101,865,718 |
35.82% |
| Wheat |
56,735,831 |
440,659,942 |
21.41% |
| Computer accessories |
56,112,248 |
403,837,846 |
68.27% |
| Electric apparatus |
45,795,322 |
700,187,965 |
31.47% |
| Miscellaneous domestic exports and special transac |
44,680,749 |
275,519,692 |
25.67% |
| Computers |
43,764,324 |
290,031,178 |
15.58% |
| Finished textile supplies |
41,030,396 |
332,266,038 |
42.79% |
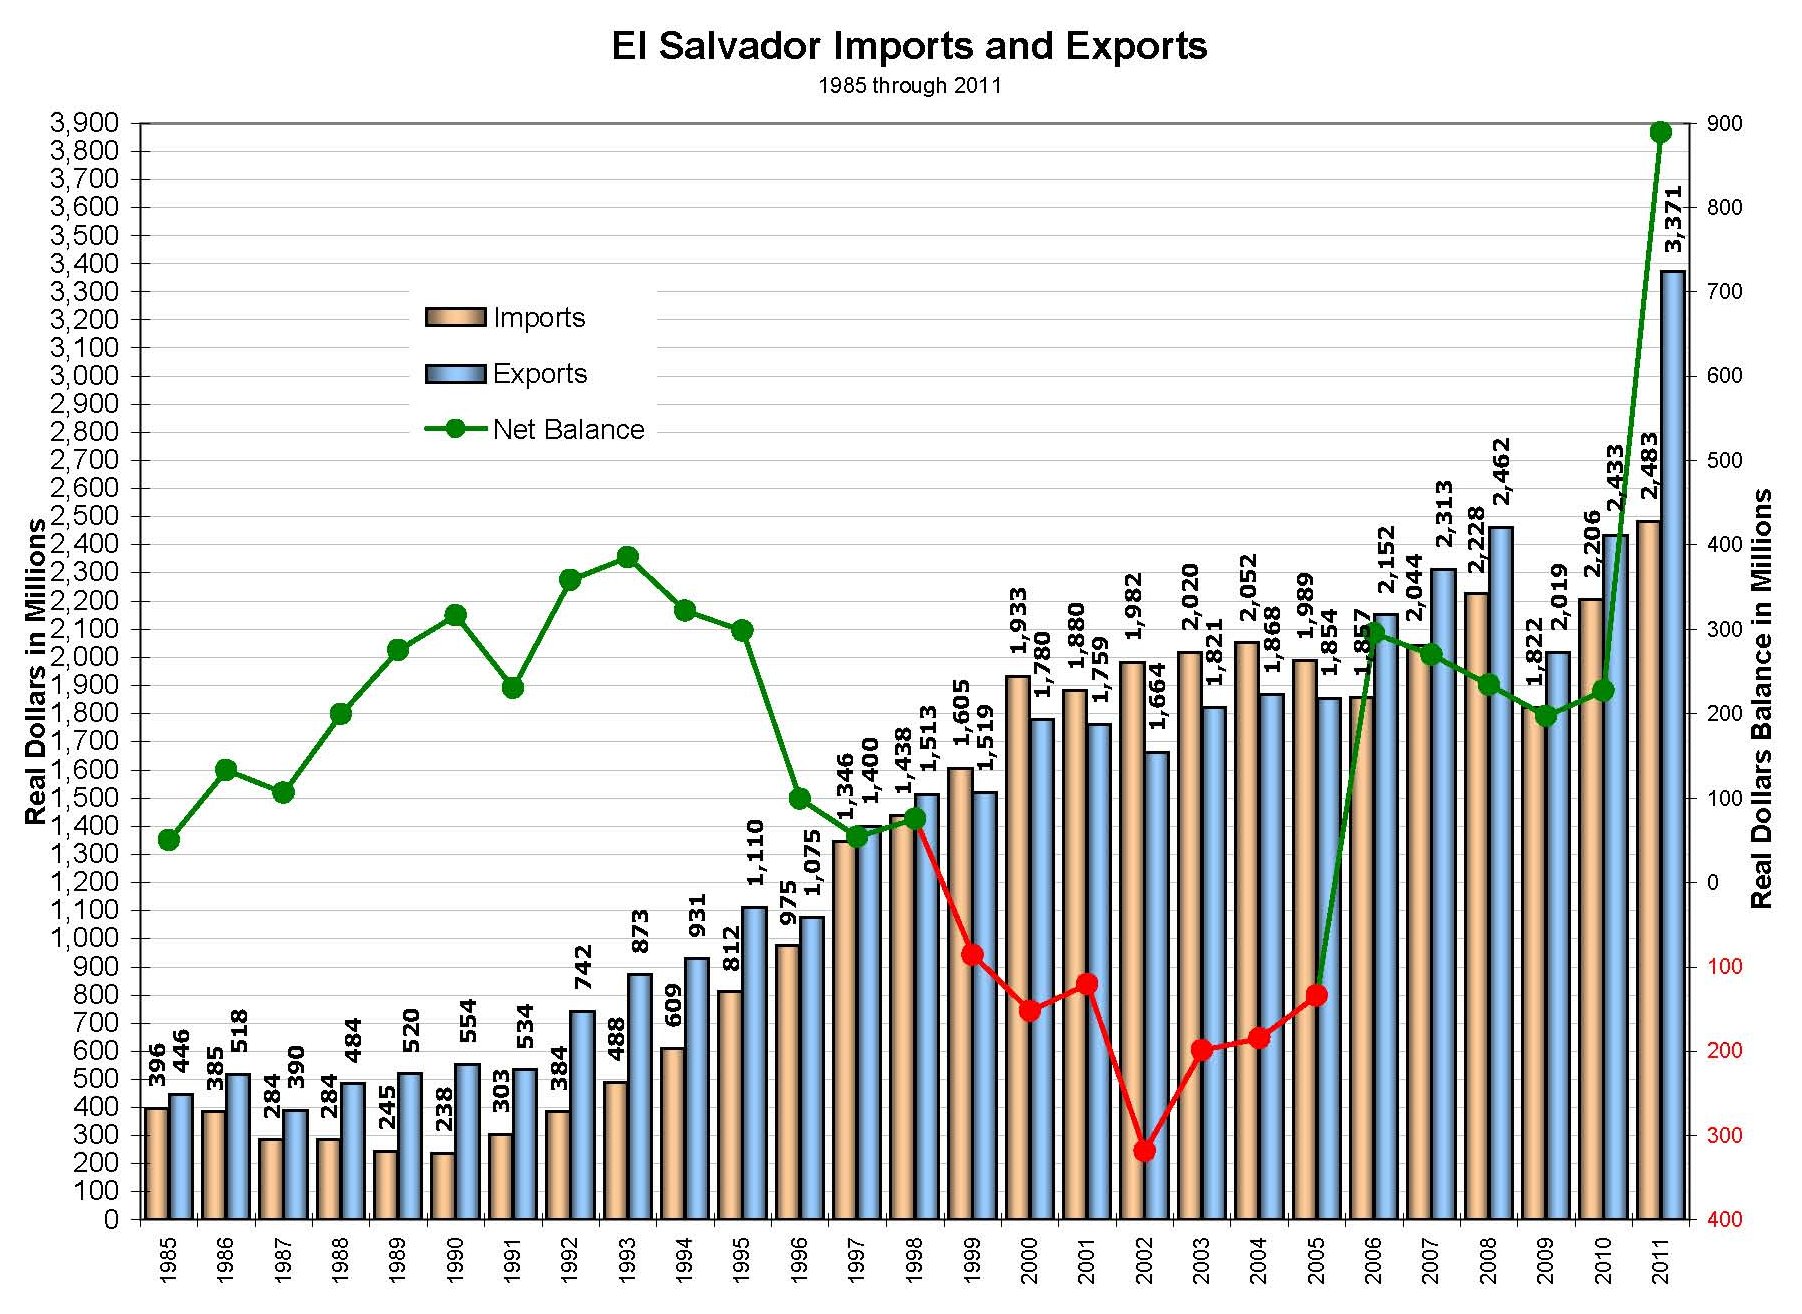
Although most years the U.S. had trade surpluses with El Salvador, we had higher surpluses through the 1990s than we have had since the CAFTA-DR was finalized. If not for the fact that we imported American products it is indisputable that we would have a continued trade deficit with El Salvador.
Click image for a larger view.
Import/export data for Global Trade can be obtained from:
Census Bureau - Foreign Trade.
Presidential Memorandum-Major Illicit Drug Transit, September 15, 2011.
Department of State - U.S. Relations With El Salvador.